Recently, most of my blogging has been directly on VMware site.
I thought i'd link you to a couple of the more popular ones here.
Embracing a DevOps Mindset, this is all about leading a team through a cultural transformation
https://blogs.vmware.com/vov/2018/07/25/embracing-a-devops-mindset-in-vmware-it-cloud-operations/
Are we ready?, a post about how VMware makes sure its SaaS services are ready for primetime!
https://blogs.vmware.com/vov/2018/12/18/9374/
VMware's private cloud team Represented at VMworld.
https://blogs.vmware.com/vmworld-archive-07-25-2017/2016/07/vmware-and-the-private-cloud-at-vmworld-2016.html
Friday, May 3, 2019

Thursday, August 23, 2018
Troubleshooting 101
Think of yourself as a doctor, but for computers. Start with "DO NO HARM" as your credo. Don't make things worse, snapshots, GO SLOWLY, think before taking any action, ask for a double check.
There are two basic approaches to troubleshooting: the stab-in-the-dark approach and the systematic approach. The stab-in-the-dark approach usually involves little knowledge of the technology involved and is completely random in nature. A systematic approach, on the other hand, involves a step-by-step approach and requires in-depth knowledge of the technology.
1) When did it start? (almost always change related, planned or unplanned)
Find an error message, try finding the starting time in the logs
2) Isolate, isolate, isolate.
How can I split this complex problem into several smaller problems. Packets go from A to Z, but don't arrive,
First divide the problem in half, check if packet makes it from A-M, if it does, then check M-Z.
If you see it didn't make it form M-Z, half it again, check M-T, then T-Z, then again, keep dividing in half.
3) the WORST problems to troubleshoot are always two things, that agitate each other.
Sometimes you have one problem, that due to redundancy, or other reasons, you don't even KNOW you have had for months.
Then another thing breaks, suddenly you have a bizarre scenario that just doesn't add up.
4) Check the health of EVERYTHING
Log into switches, servers, (consoles people) often errors don't show up in logs, but you'll see them sitting right in of you.
5) Get creative, approach the problem from different angles, ask for help, a second point of view or skillset can really help. Go play foosball, step back for 20 minutes and refresh your mind.
More Advice:
Look for workarounds, or multiple paths to restore service.
If you have a known method to restore, but it may take hours or days, then try to work both paths in parallel
Saturday, March 19, 2016
Netgear VLAN & PVID making me doubt my sanity
Rebuilding my home lab tonight, I got stuck because every time I plugged a cable into my switch, everything died.

I came to realize that the reason for my problems was the fact I had been moving cables around in my Netgear GS748T v5 switch and even though it seemed like the VLANs configs were correct, somehow my old PVID (Advanced-Port PVID Configuration) settings were messing things up. The scenario I have is 4 ESX hosts, one Synology array, plus one Internet link. I have four VLANS, 1=Default/home network, 10=iSCSI, 20=Internet, 30=VSAN traffic. I just upgraded my hosts to the Intel NUC's (because I want to be like William Lam), These Intel NUC's can only use the 1 onboard NIC with vSphere 6.0 U2 right now, hopefully someone will integrate a USB nic driver soon. So back to my challenge, the ESX hosts can ride on the default network and use VLAN tagging for access to the other 3 networks. My internet connection is a dumb device that can't use VLAN tagging, so I needed to find a way of integrating it. Normally that would just be an untagged port, but that doesn't work on these Netgear Switches. In order to get that to work I had to setup PVID, I used port g1 for Internet and g48 for iSCSI, and g39-42 for the ESXi hosts. The key here is that in the PVID settings, the port must be a Member of the VLAN, but not Tagged.

That seems to be working well. From the VLAN membership tab, I left my default VLAN (1) everywhere but the two untagged ports I will need my storage and internet connected to. For the other 3 VLANs I mostly emptied it out and set it up like this:


If you have a similar setup and you get stuck, I hope this helps you!

I came to realize that the reason for my problems was the fact I had been moving cables around in my Netgear GS748T v5 switch and even though it seemed like the VLANs configs were correct, somehow my old PVID (Advanced-Port PVID Configuration) settings were messing things up. The scenario I have is 4 ESX hosts, one Synology array, plus one Internet link. I have four VLANS, 1=Default/home network, 10=iSCSI, 20=Internet, 30=VSAN traffic. I just upgraded my hosts to the Intel NUC's (because I want to be like William Lam), These Intel NUC's can only use the 1 onboard NIC with vSphere 6.0 U2 right now, hopefully someone will integrate a USB nic driver soon. So back to my challenge, the ESX hosts can ride on the default network and use VLAN tagging for access to the other 3 networks. My internet connection is a dumb device that can't use VLAN tagging, so I needed to find a way of integrating it. Normally that would just be an untagged port, but that doesn't work on these Netgear Switches. In order to get that to work I had to setup PVID, I used port g1 for Internet and g48 for iSCSI, and g39-42 for the ESXi hosts. The key here is that in the PVID settings, the port must be a Member of the VLAN, but not Tagged.

That seems to be working well. From the VLAN membership tab, I left my default VLAN (1) everywhere but the two untagged ports I will need my storage and internet connected to. For the other 3 VLANs I mostly emptied it out and set it up like this:


If you have a similar setup and you get stuck, I hope this helps you!
Monday, December 9, 2013
VMware vSAN IOPS testing
Take this with a grain of sand, these are only initial figures. I am using a combination of IOMeter for Windows and fio for Linux.
Baseline redundancy and caching, no storage profiles used, only using vSAN as a datastore (I’ll do the other options later)
My vSAN is made of 3 identical ESXi hosts, with a single SSD Samsung 840 250GB, and two Seagate 750GB SATA drives. vSAN has a dedicated single 1GB connection, no jumbo frames used. (yes there could be bottlenecks at several spots, I haven’t dug that deeply, this is just a ‘first pass’ test)
The end result of this VERY BASIC test is this:
vSAN random reads were an average of 31 times faster than a single SATA disk
vSAN random writes were an average 9.1 times faster than a single SATA disk
More Details Below:
Regular single disk performance (just for a baseline before I begin vSAN testing)
Random Read (16k block size)
first test = 79 IOPS
second test = 79 IOPS
Random Write (16k block size)
first test = 127 IOPS
second test = 123 IOPS
vSAN disk performance with same VM vMotion to the vSAN
Random Read (16k block size)
first test = 2440 IOPS
second test = 2472 IOPS
Random Write (16k block size)
first test 1126 IOPS
second test 1158 IOPS
Commands used in fio:
sudo fio --directory=/mnt/volume --name fio_test --direct=1 --rw=randread --bs=16k --size=1G --numjobs=3 --time_based --runtime=120 —-group_reporting
sudo fio --directory=/mnt/volume --name fio_test --direct=1 --rw=randwrite --bs=16k --size=1G --numjobs=3 --time_based --runtime=120 —-group_reporting
I mentioned I did use IOMeter in windows, the initial results were very similar to the fio results above. I will post those once I have the time try each solution and go deeper into identifying bottlenecks and getting more detailed, adding more hosts, etc…
Sunday, December 8, 2013
VMware vSphere 5.5 vSAN beta ineligable disks
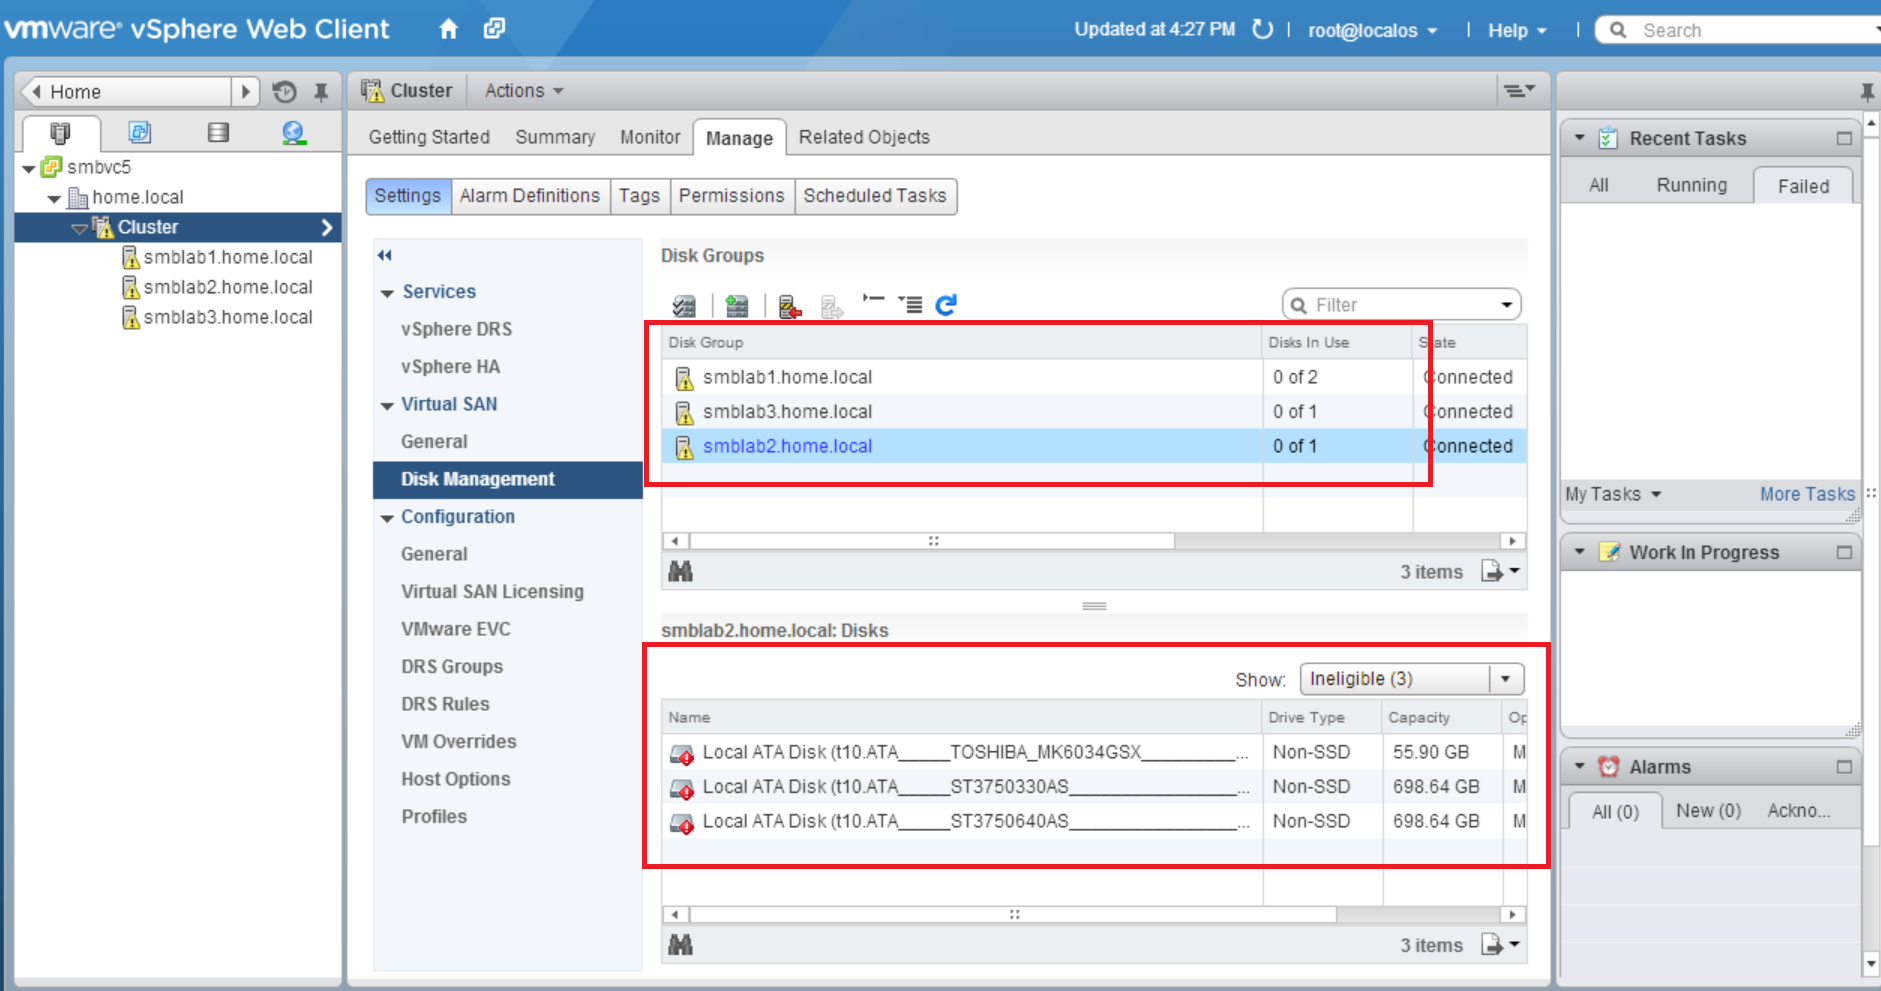
While building my home lab to use vSAN and NSX following Cormac Hogans's great instructions, I've encountered an issue that the disk I am trying to use for vSAN are not showing as available. In the "Cluster/Manage/Virtual SAN/Disk Management" under Disk Groups, I see only one of my 3 hosts has 0/2 disks in use, the others show 0/1. My setup is this, I purchased 3 new 250GB Samsung SSD drives (one for each host), and am trying to re-use 6 older Seagate 750GB SATA drives. My first thought, is why does it only say 0/1 in use on two of the servers? I have 4 drives in that server, a 60GB boot drive, 1 SSD, & 2 SATA drives, so why doesn't it say 0/3 or 0/4? I noticed in the bottom pane, I can choose to show ineligable drives, there I see the 3 drives I can't use. I understand why I can't use my Toshiba boot drive, but why do my 750GB Seagate drives also show Ineligable?

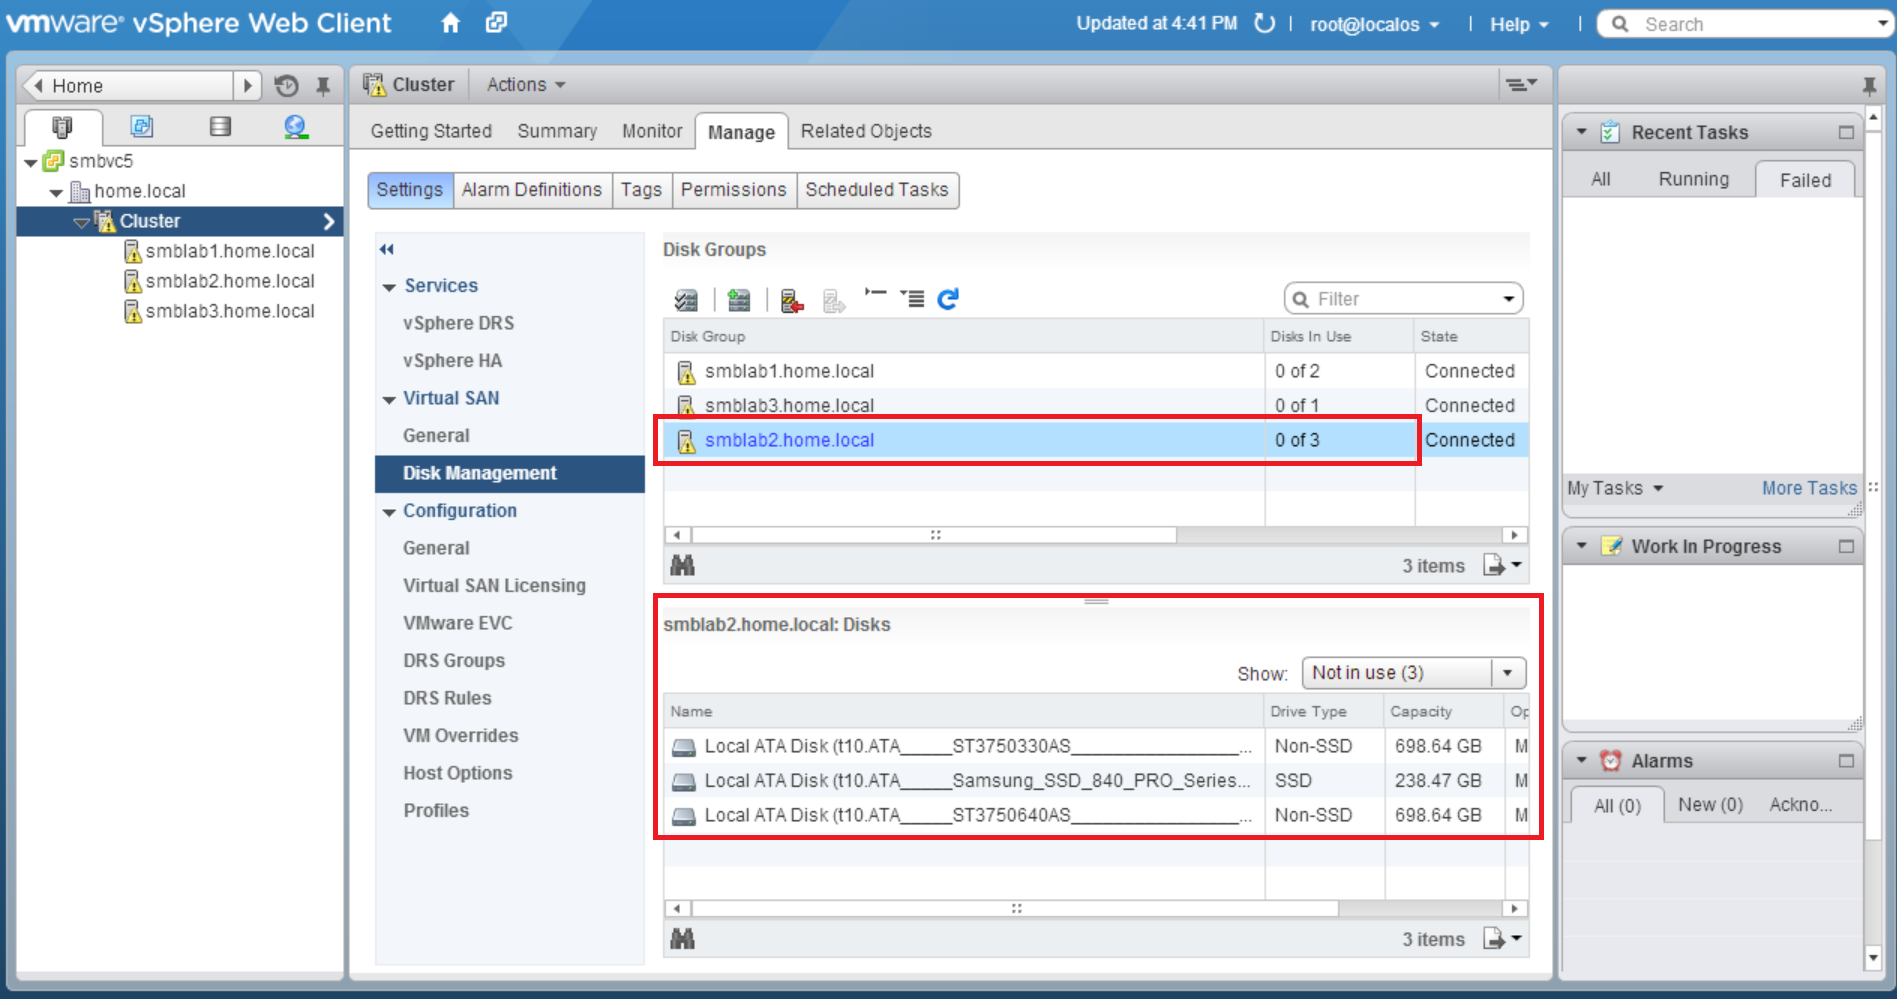
I played with enabling AHCI, but knowing there is a bug in the beta I wanted to avoid it. See here: http://blogs.vmware.com/vsphere/2013/09/vsan-and-storage-controllers.html. This unfortunately did not change the situation. I finally realized that possibly those drives still had a legacy partition on them. After nuking the partitions on those drives, the disk now show up as eligable drives. I tried this first on my server smblab2, and you see that 0/3 are not in use, which is what I would have expected originally. Not in use in this context basically means "eligable".

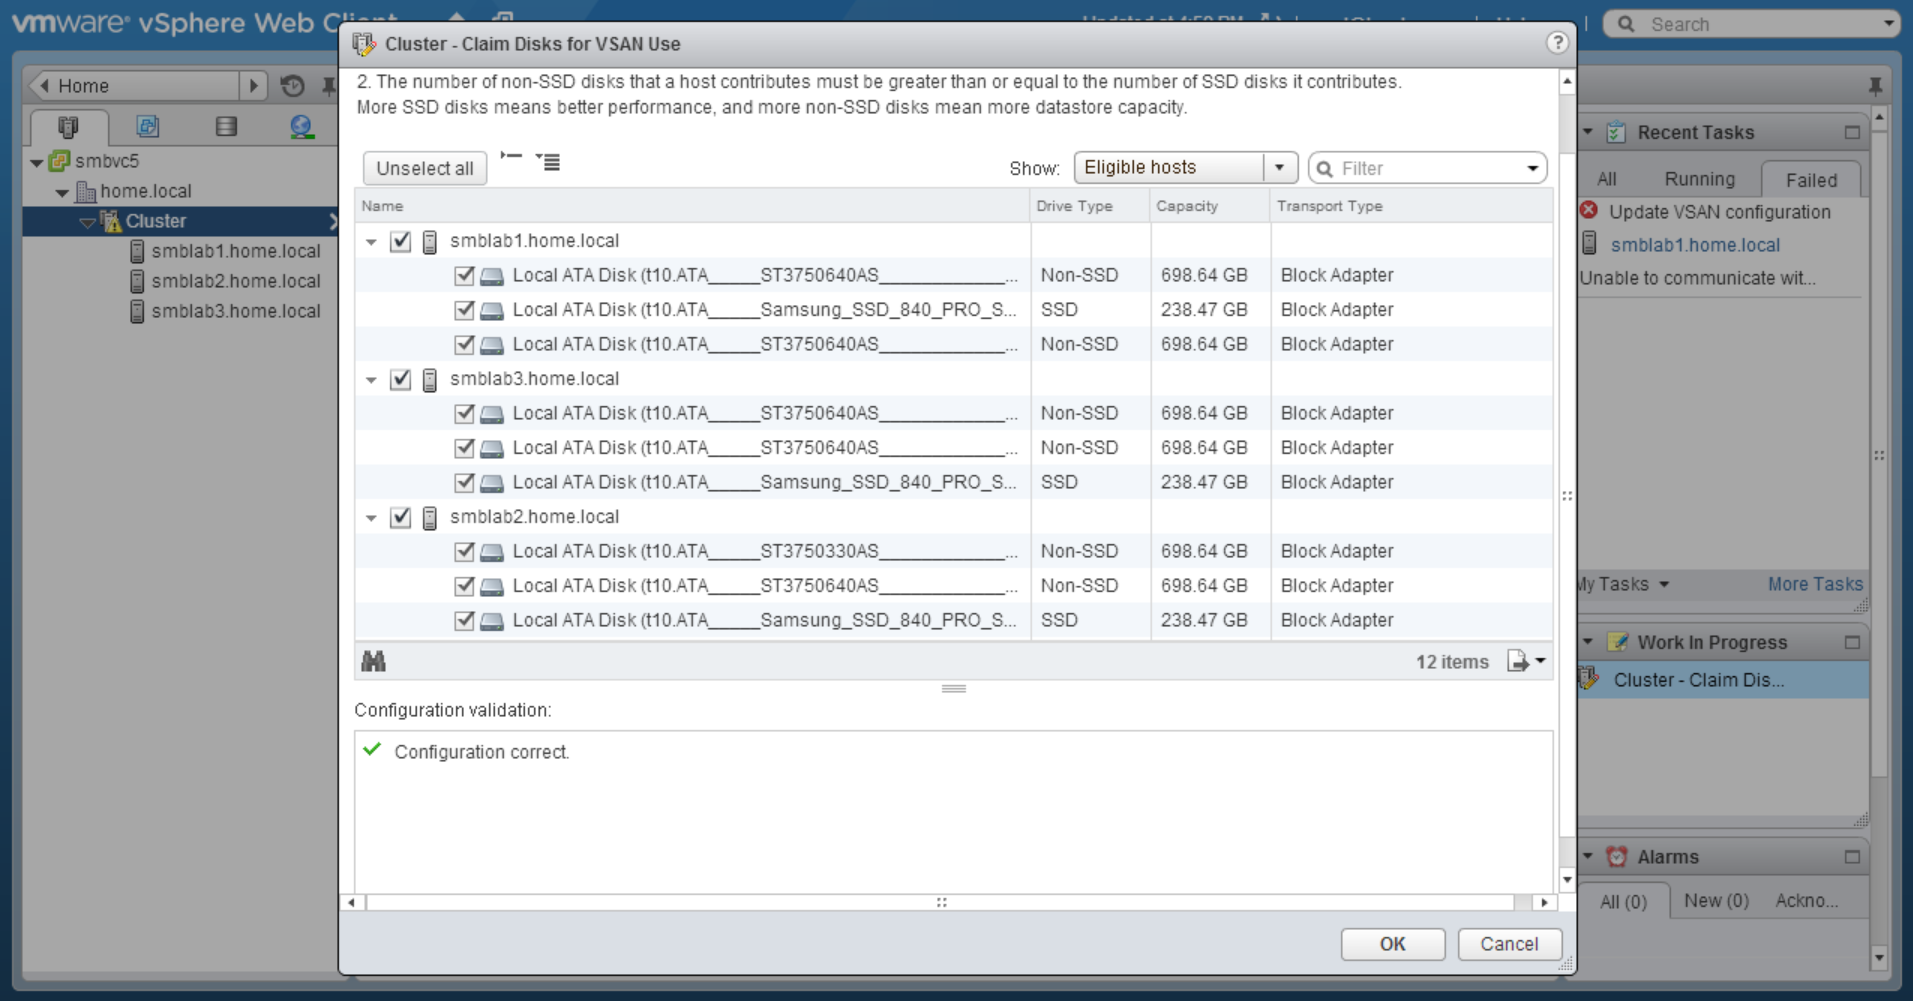
I was then able to Claim the disks for VSAN Use:

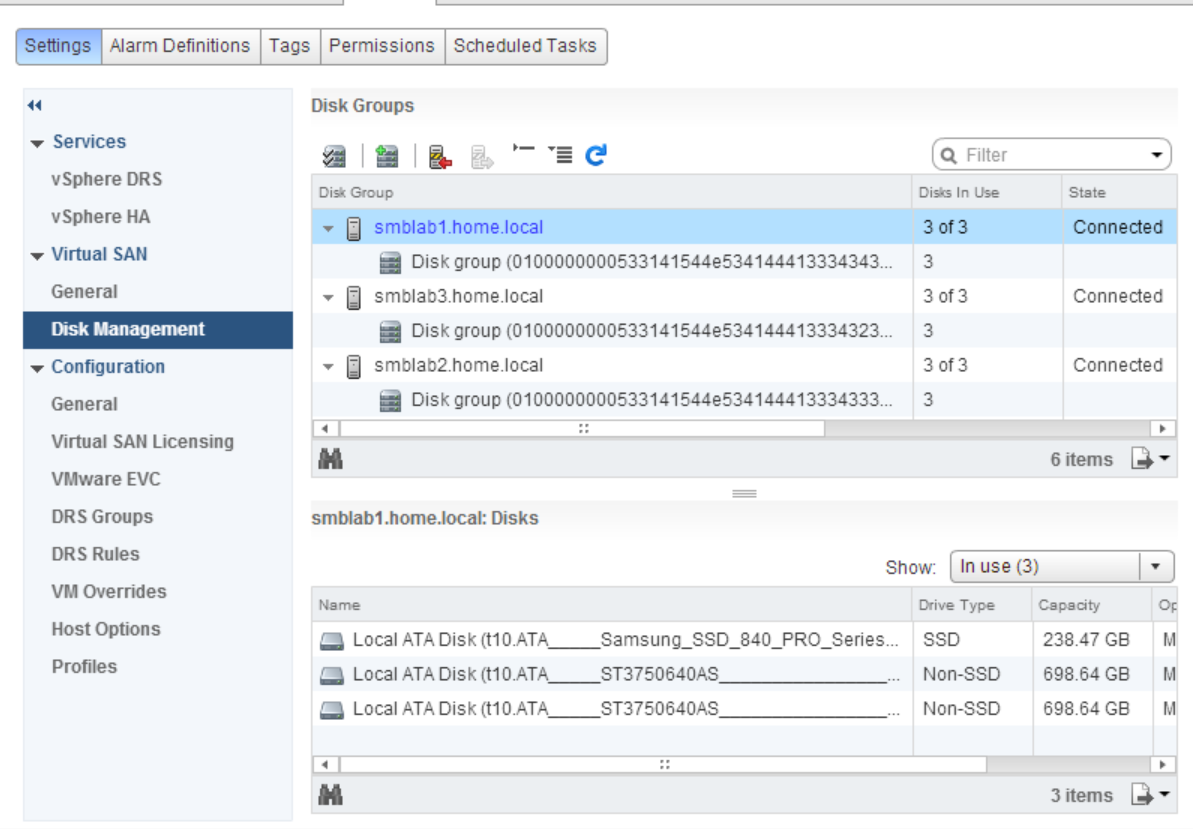
Then finally create the disk groups.

Many others suggest running vSAN in a Virtual environment, which is great for learning, you can even get the experience doing the Hands on Labs (Free 24/7 Now!), but I wanted to do some performance testing, and for that I needed a physical environment. Now that I've gotten past my little problem, it's working great!
I played with enabling AHCI, but knowing there is a bug in the beta I wanted to avoid it. See here: http://blogs.vmware.com/vsphere/2013/09/vsan-and-storage-controllers.html. This unfortunately did not change the situation. I finally realized that possibly those drives still had a legacy partition on them. After nuking the partitions on those drives, the disk now show up as eligable drives. I tried this first on my server smblab2, and you see that 0/3 are not in use, which is what I would have expected originally. Not in use in this context basically means "eligable".
I was then able to Claim the disks for VSAN Use:
Then finally create the disk groups.
Many others suggest running vSAN in a Virtual environment, which is great for learning, you can even get the experience doing the Hands on Labs (Free 24/7 Now!), but I wanted to do some performance testing, and for that I needed a physical environment. Now that I've gotten past my little problem, it's working great!
Monday, November 25, 2013
VMworld 2013 Hands On Labs Dashboards
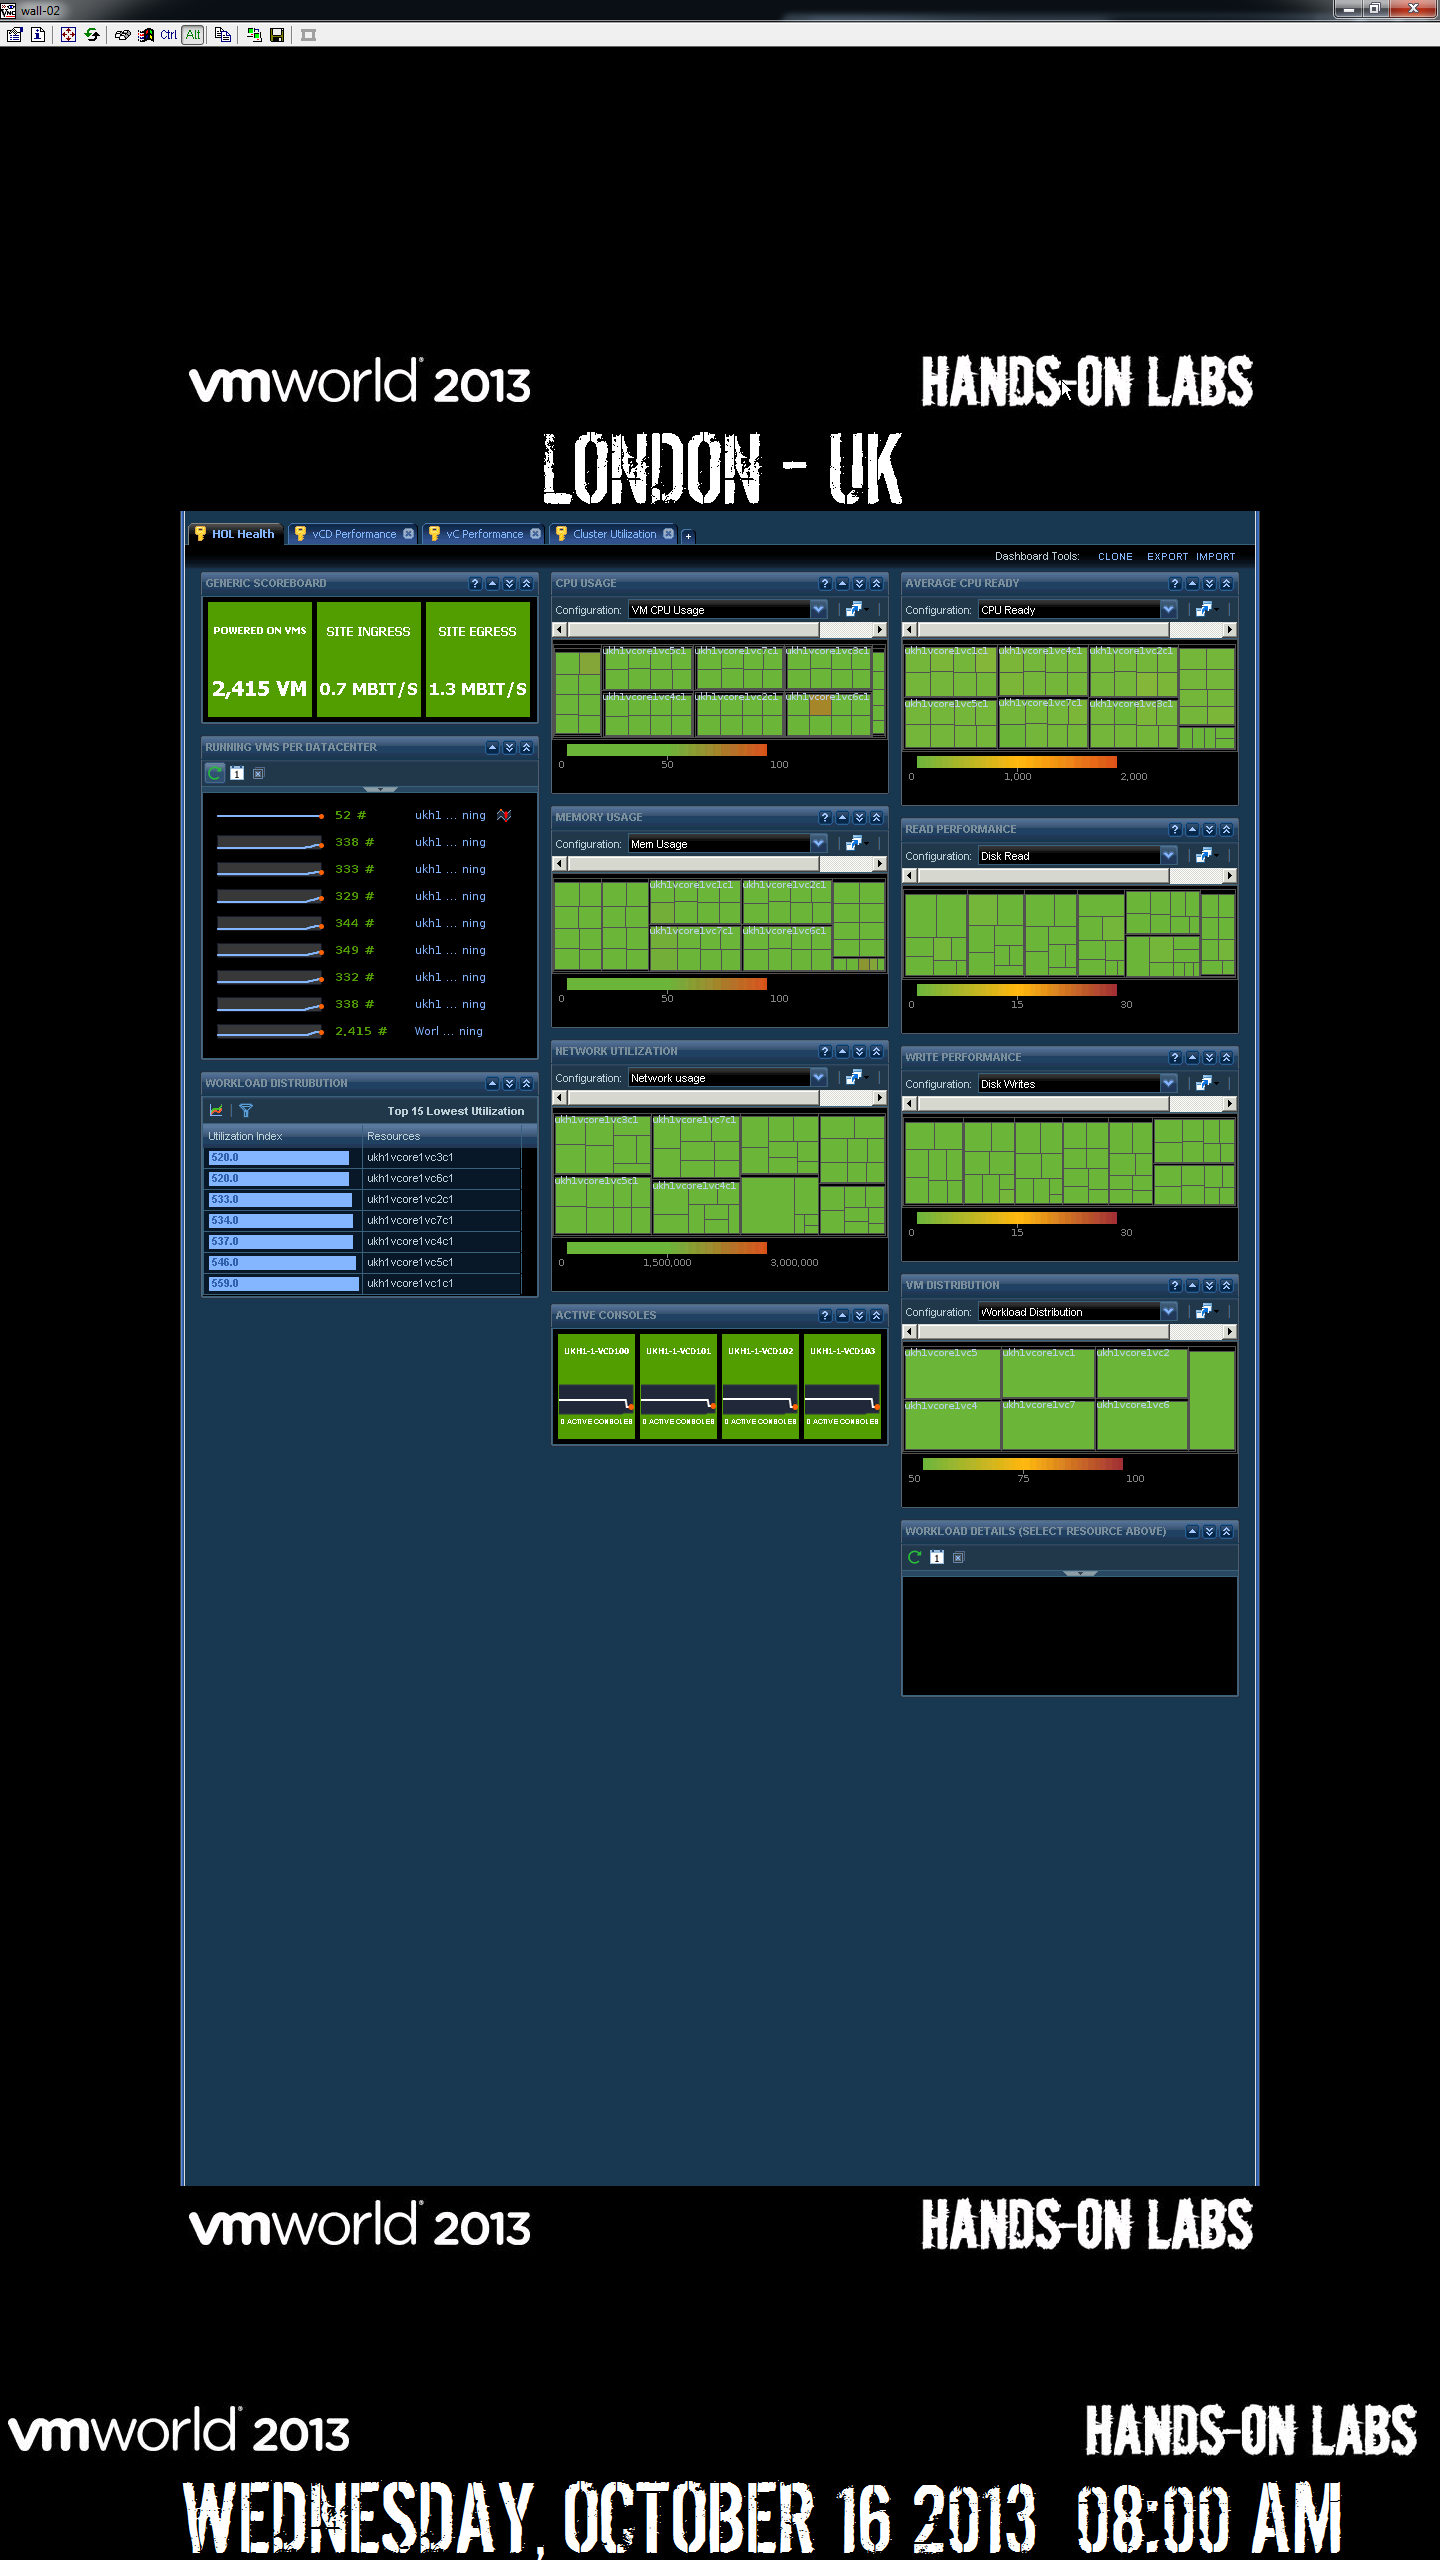
I’ve been asked several times to publish these as not everyone got to take pictures, or they were not clear enough.
We chose to build custom VMware® vCenter™ Operations Management Suite™ (vC Ops) dashboards. The Built-in vC Ops dashboards are build around a normal datacenter where workloads live indefinitely, and trending is key, for our environment, workloads are created and destroyed so frequently, that this data isn’t key. Also in a normal environment, the VM’s are crucial, but in ours, the infrastructure is.
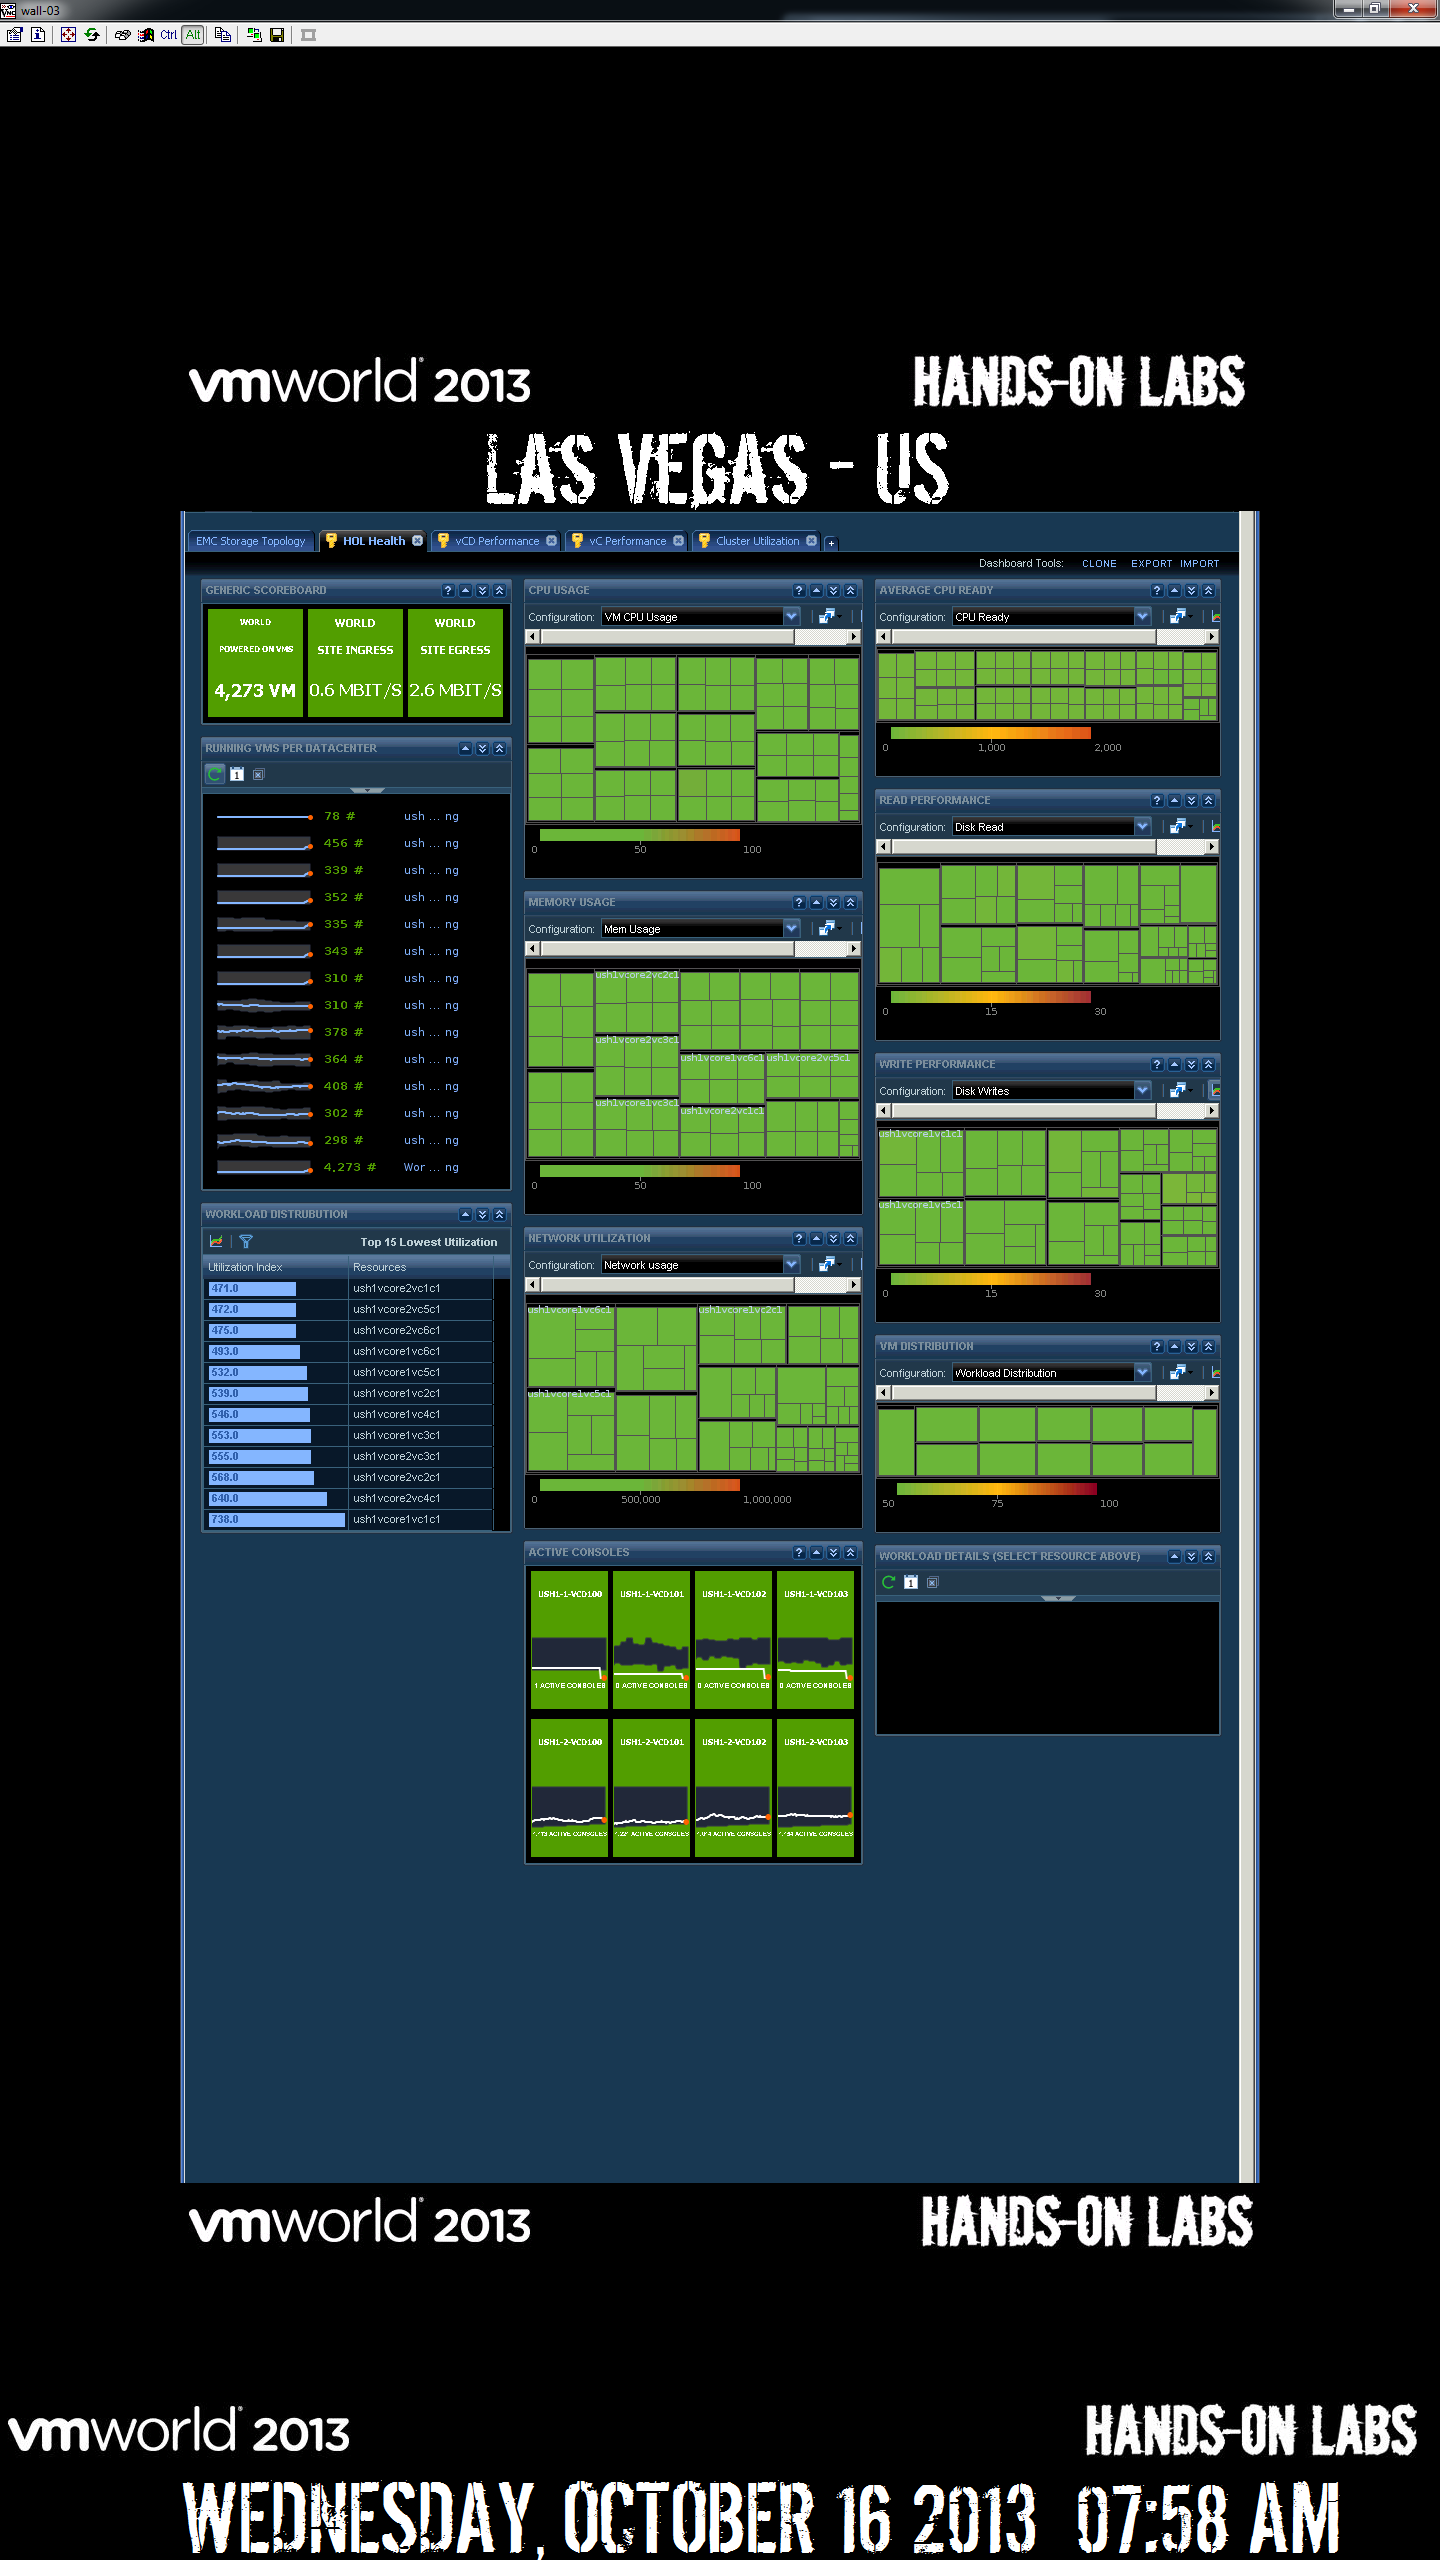
HOL was built with two major sites for each show. For the EMEA VMworld, we used London & Las Vegas. The dashboards below were taken right before the show opened in the morning, so there isn’t much if any load in London, there is some load in Las Vegas because that is where we were running the 24/7 public Hands on Labs. The first dashboard for each site contains metrics around traditional constraints, such as CPU, Memory, Storage IOPS, Storage Usage, & Network Bandwidth. These are all done at the vCenter level as the lab VM’s only live 90 minutes we really don’t care much about their individual performance as we can’t tune them before they are recycled. We do care about the underlying infrastructure and we are watching to make sure they have plenty of every resource so that they can run optimally. Much of the data that we fed into vC Ops comes from vCenter Hyperic
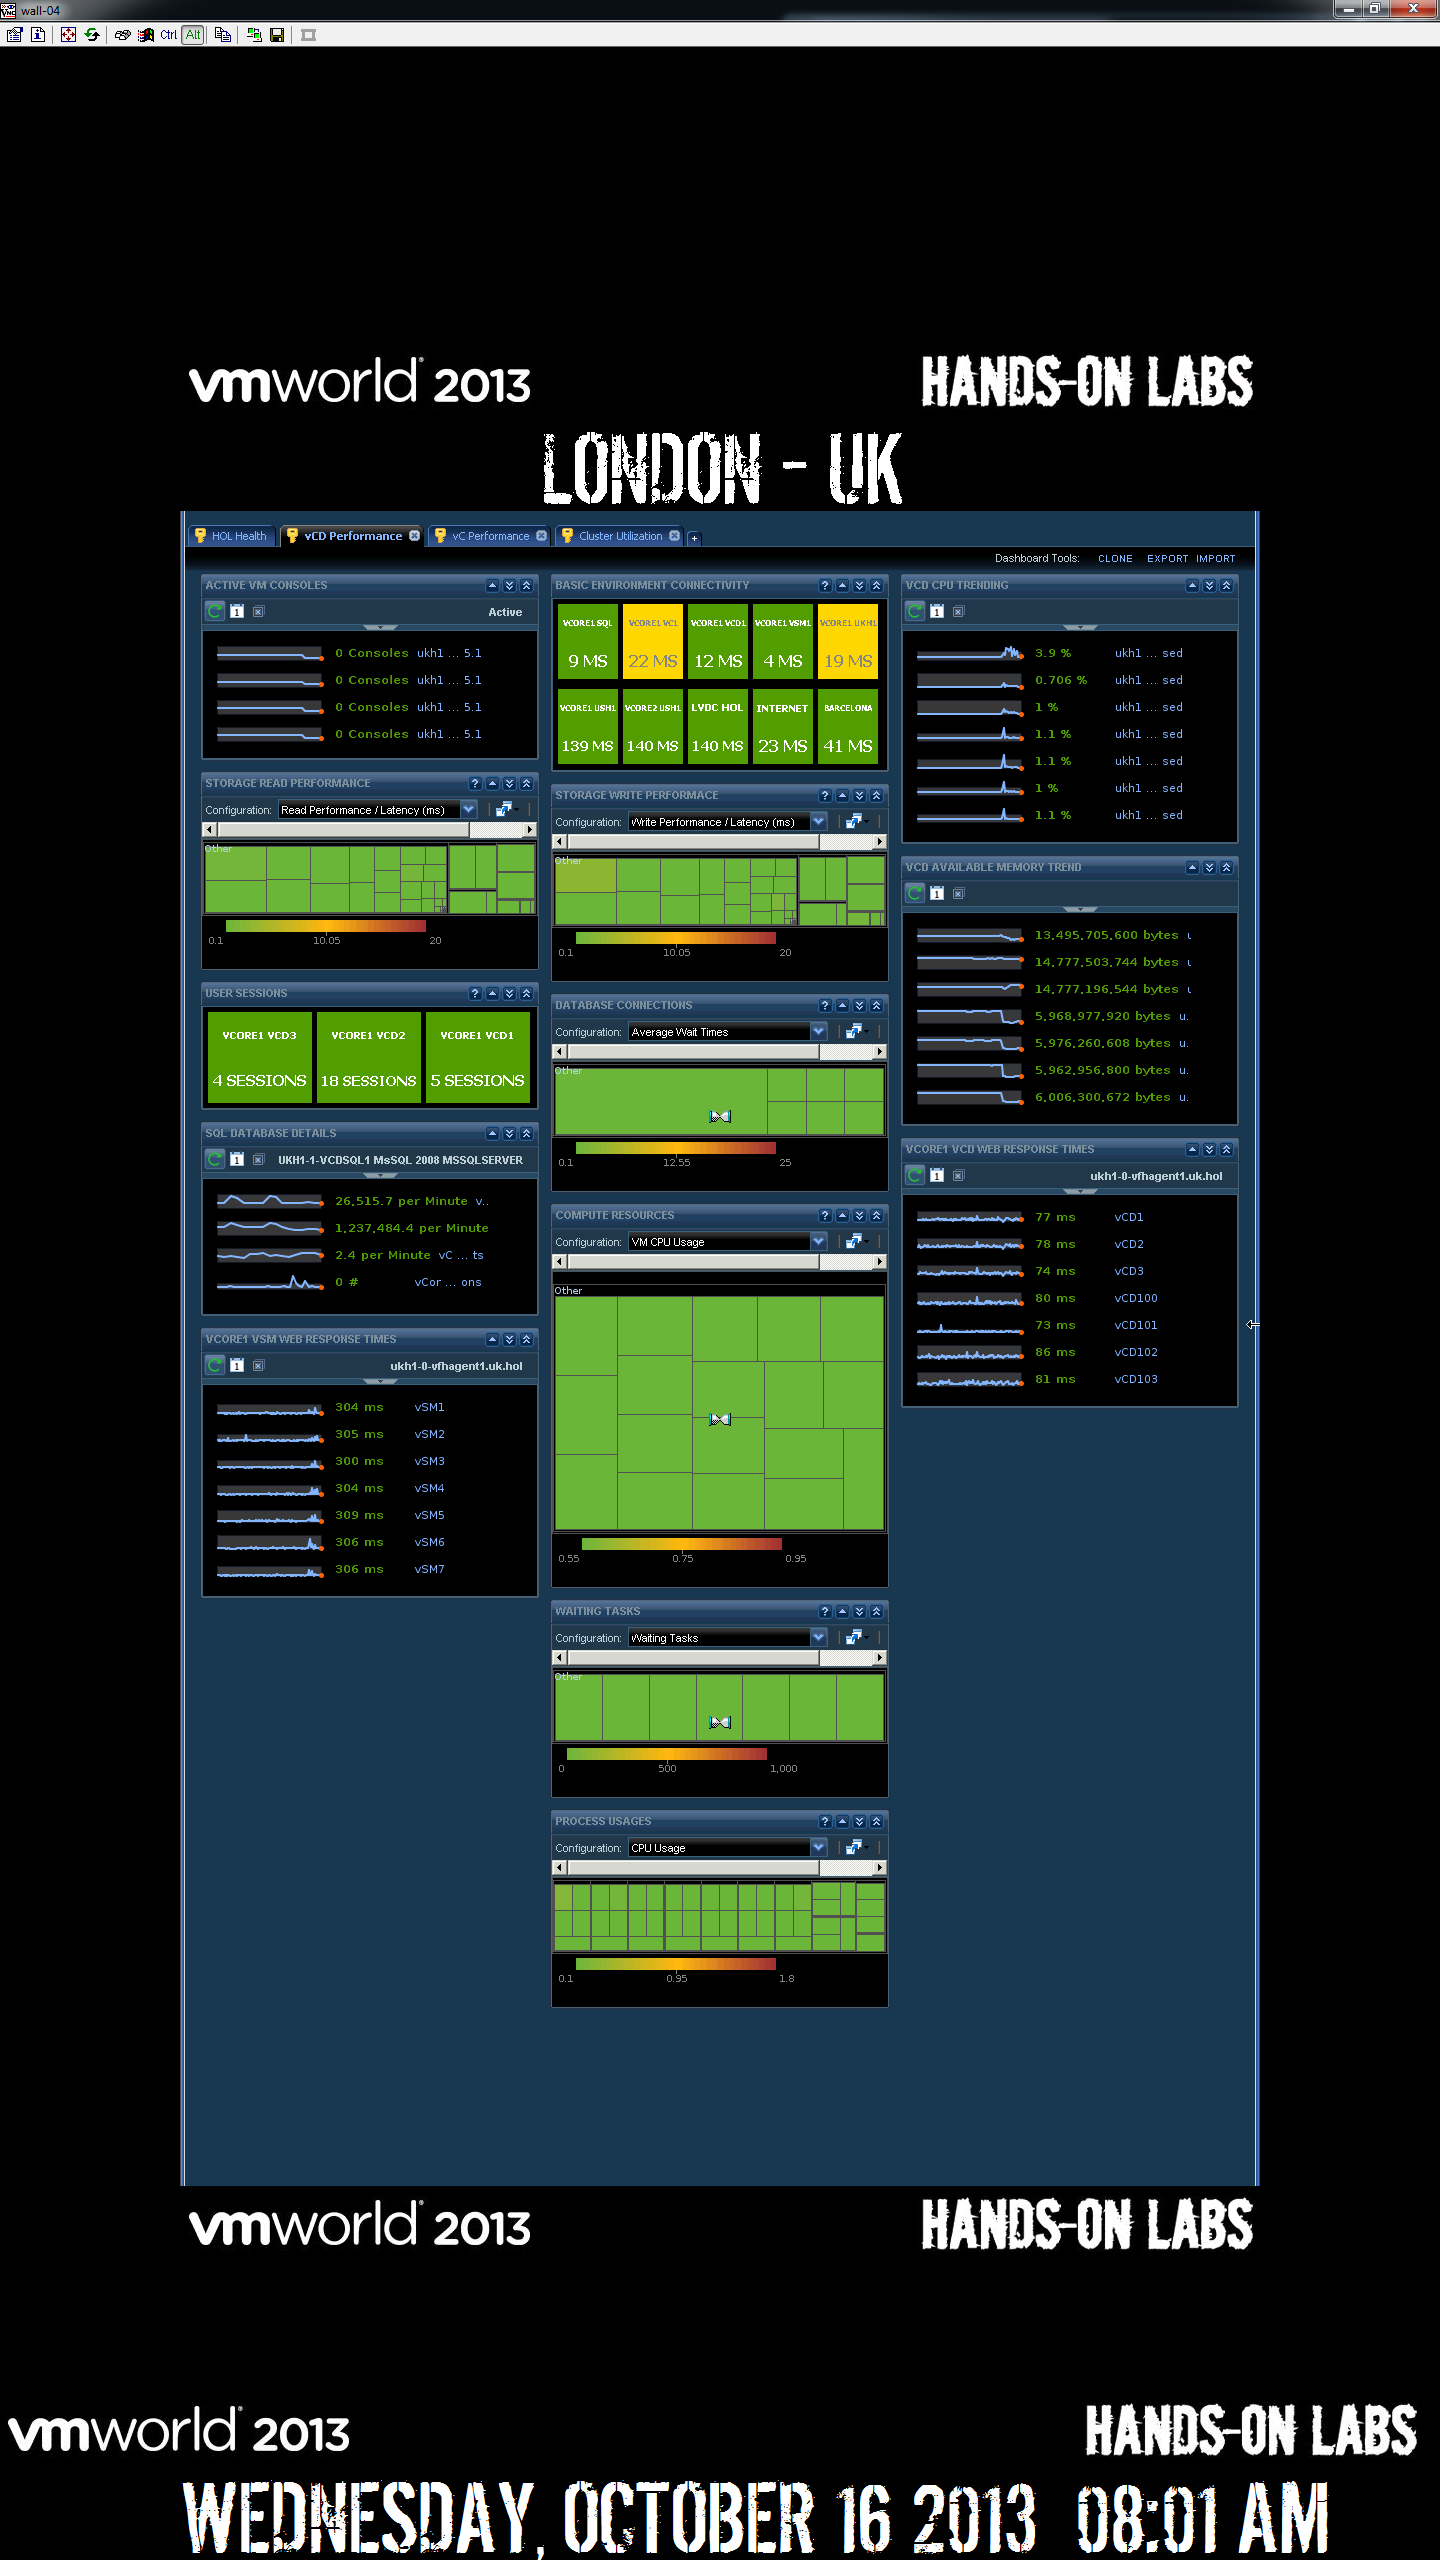
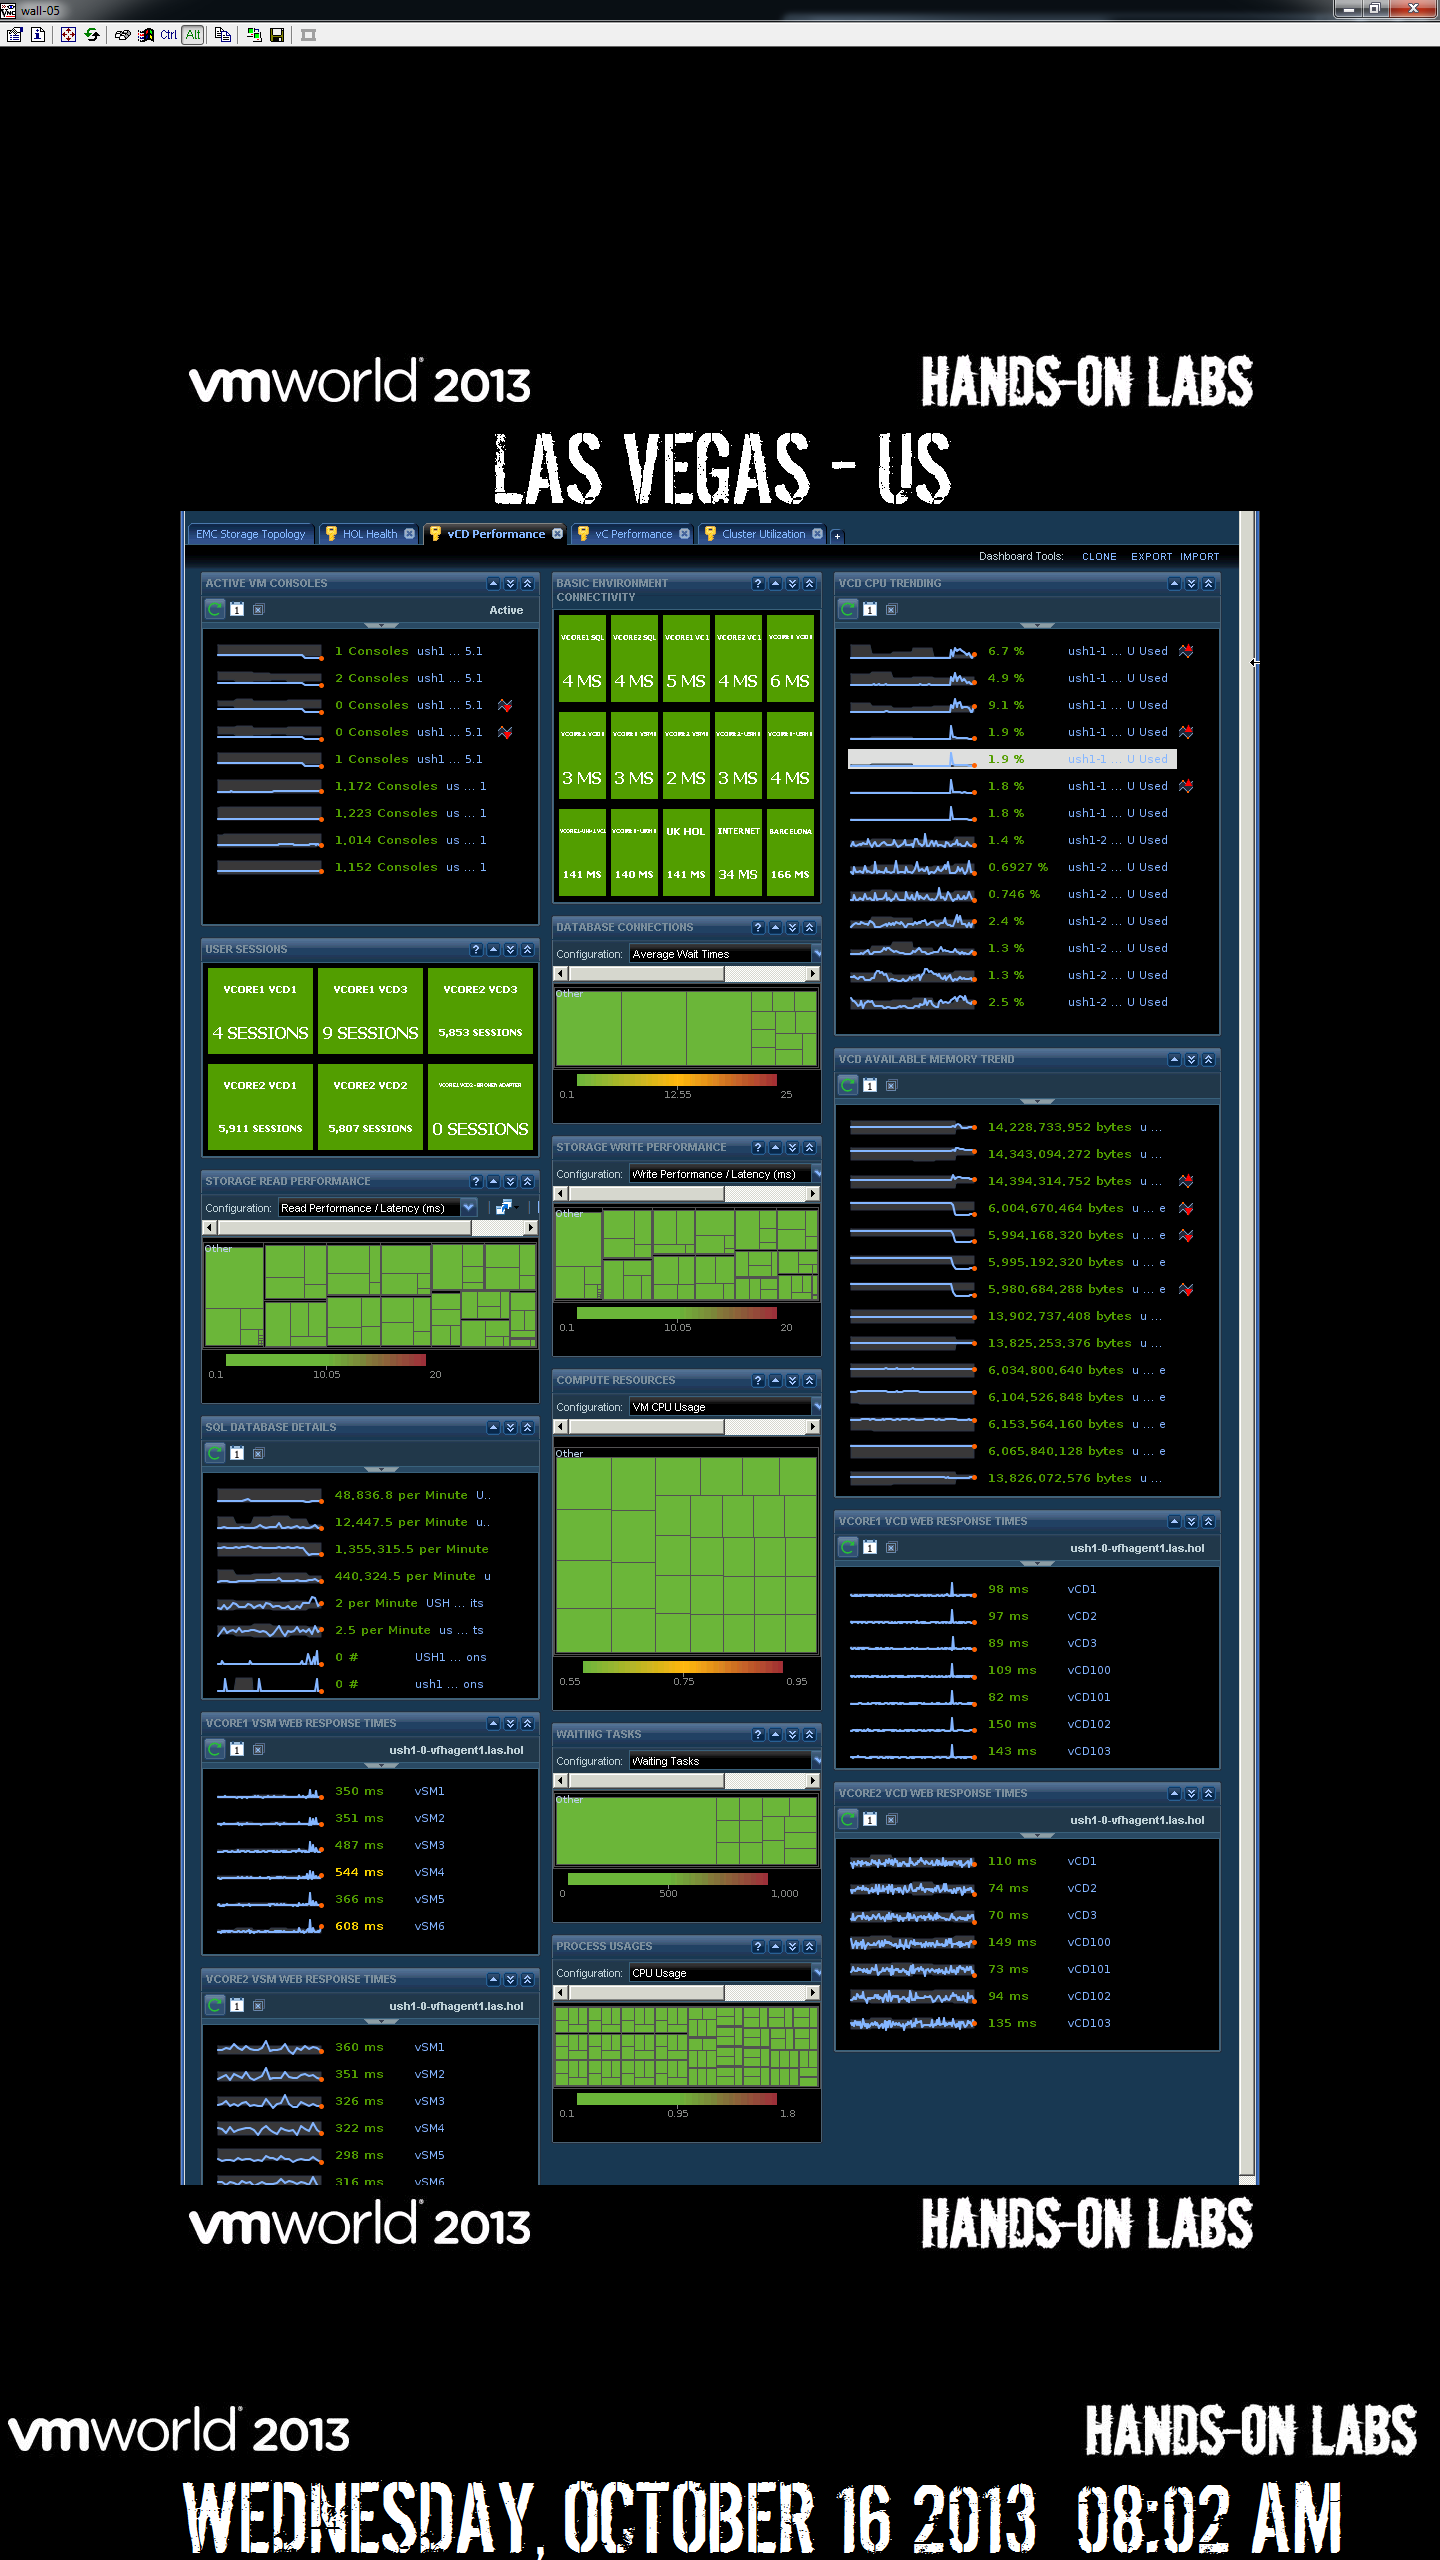
The second dashboard below is looking at vCloud Director Application performance. We looked directly into inspecting each Cell Server for # of proxy connections, cpu, & memory. We also looked into the vSM to verify the health of the vShield Manager VM’s. Lastly we were concerned with the SQL DB performance, so we were watching the transactional performance, making sure there wasn’t too many waiting tasks, or DB wait times.
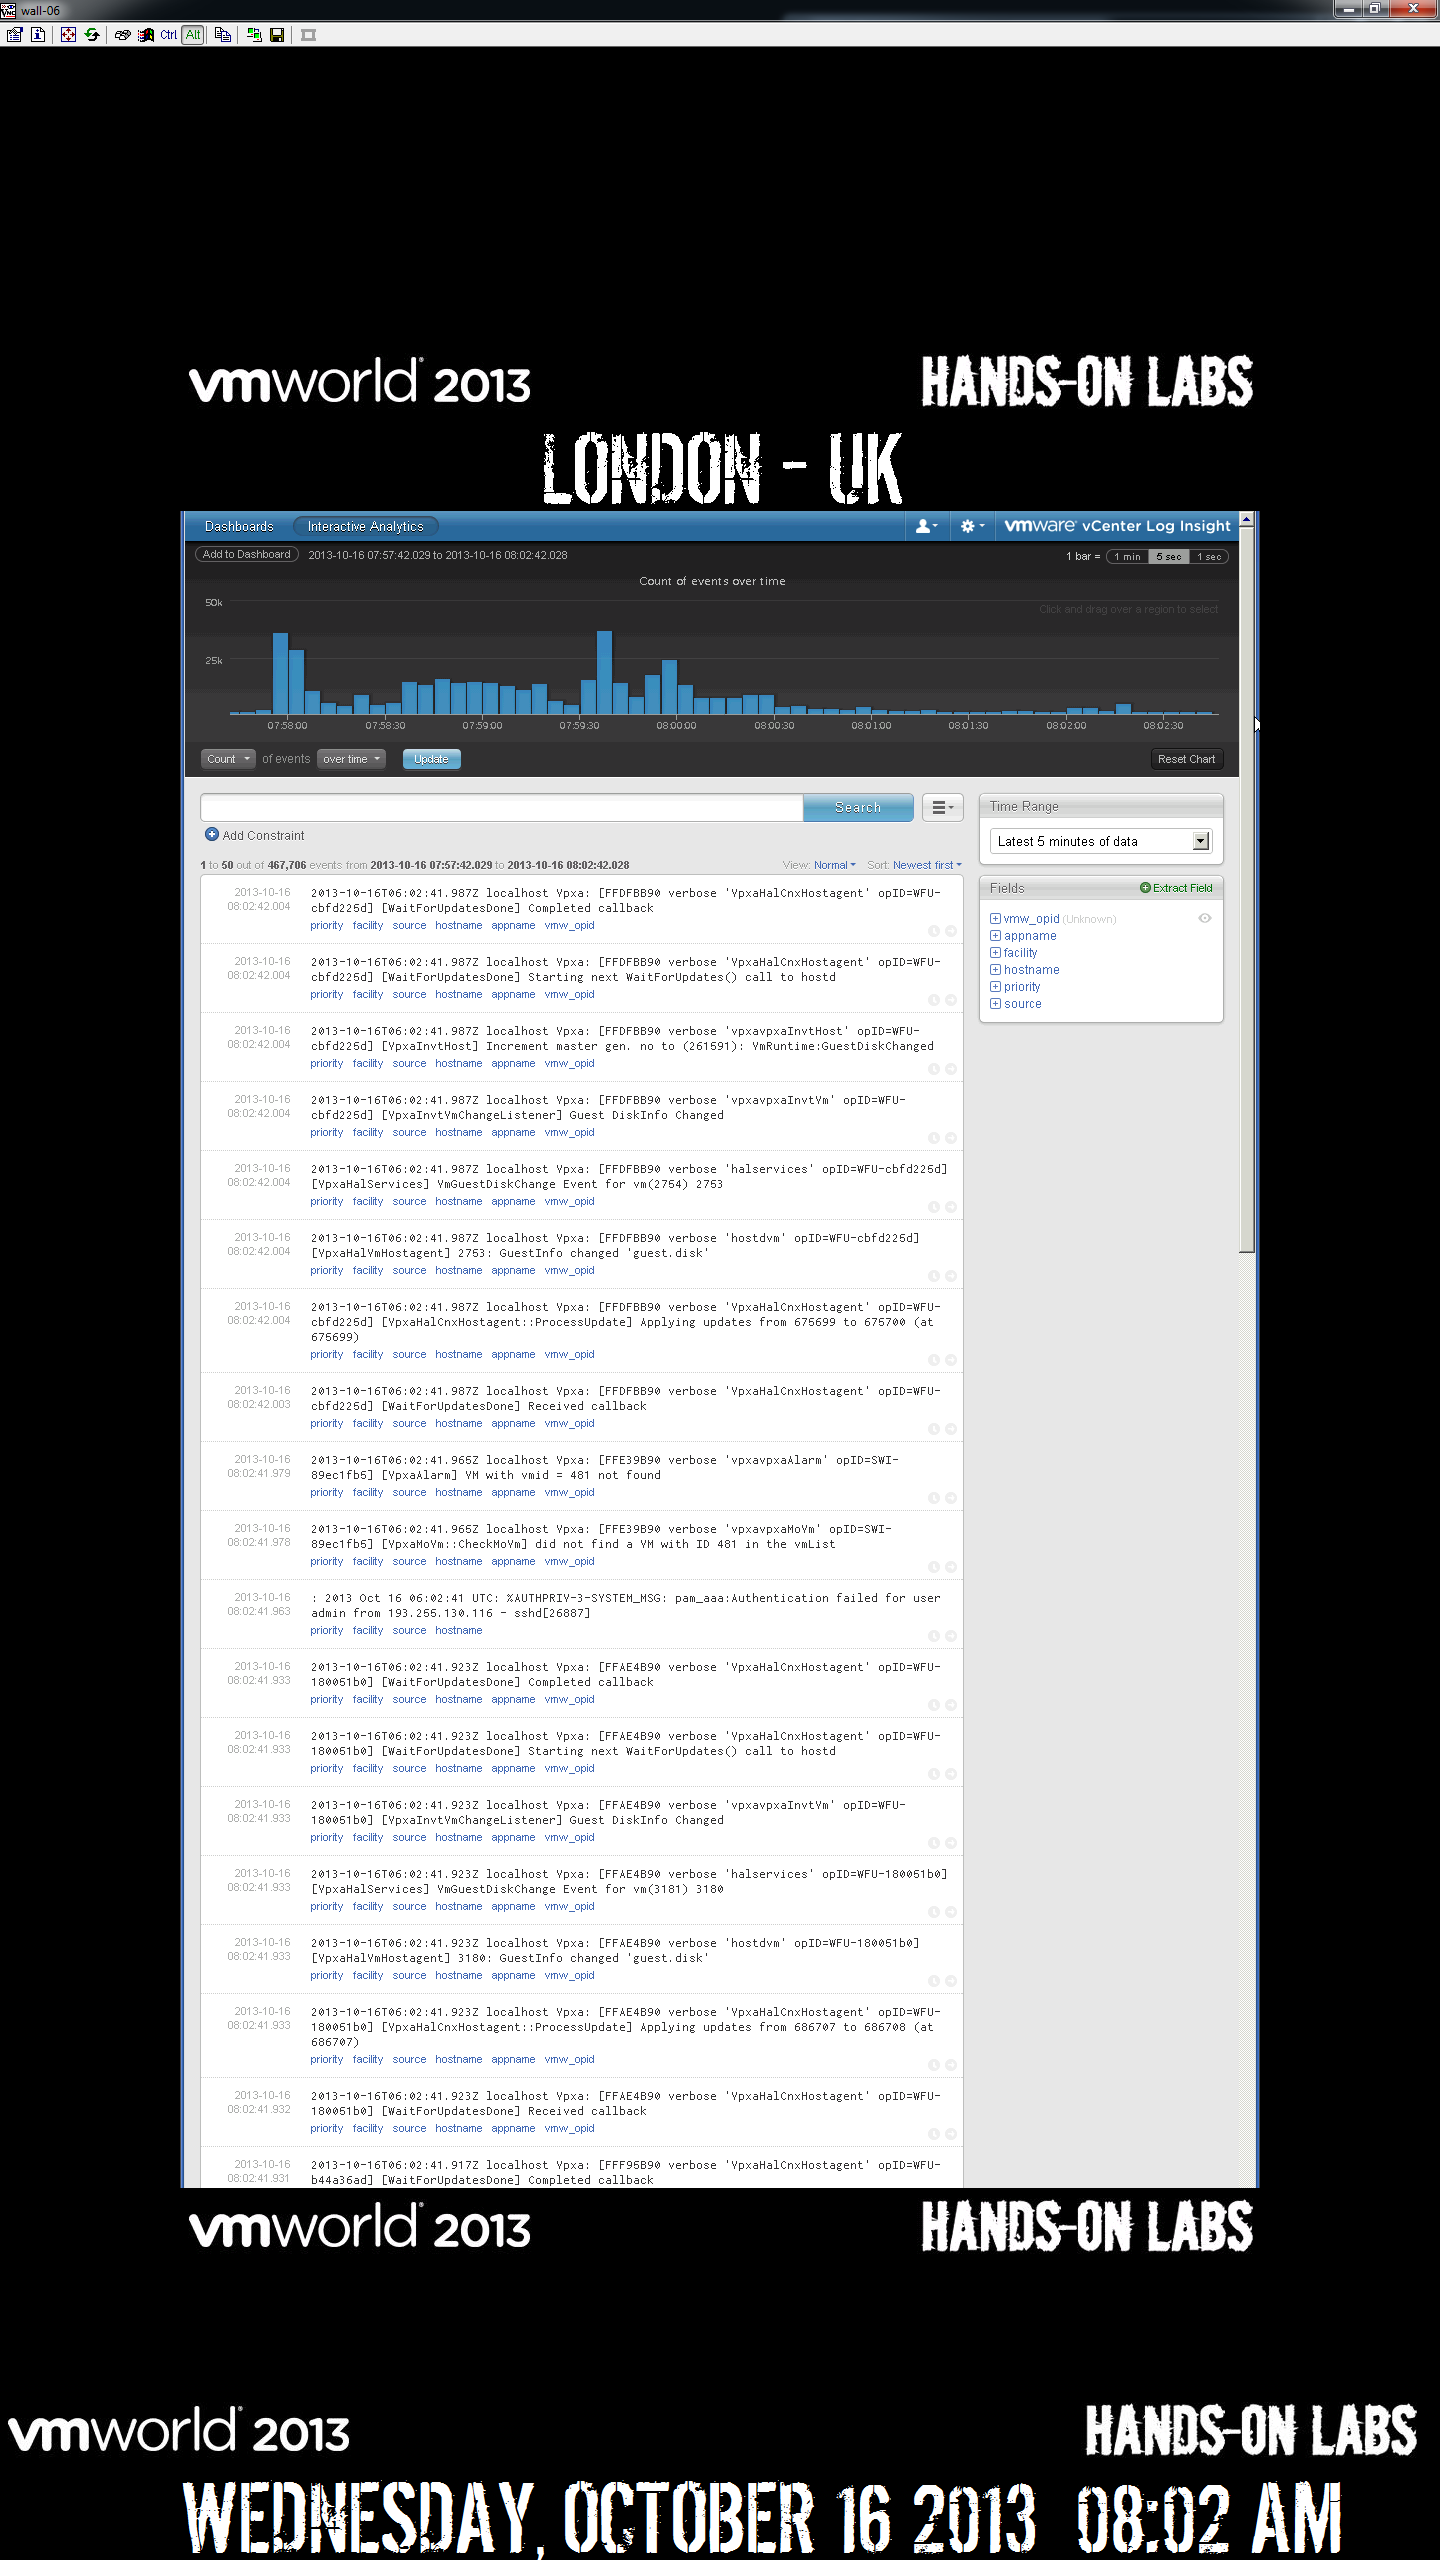
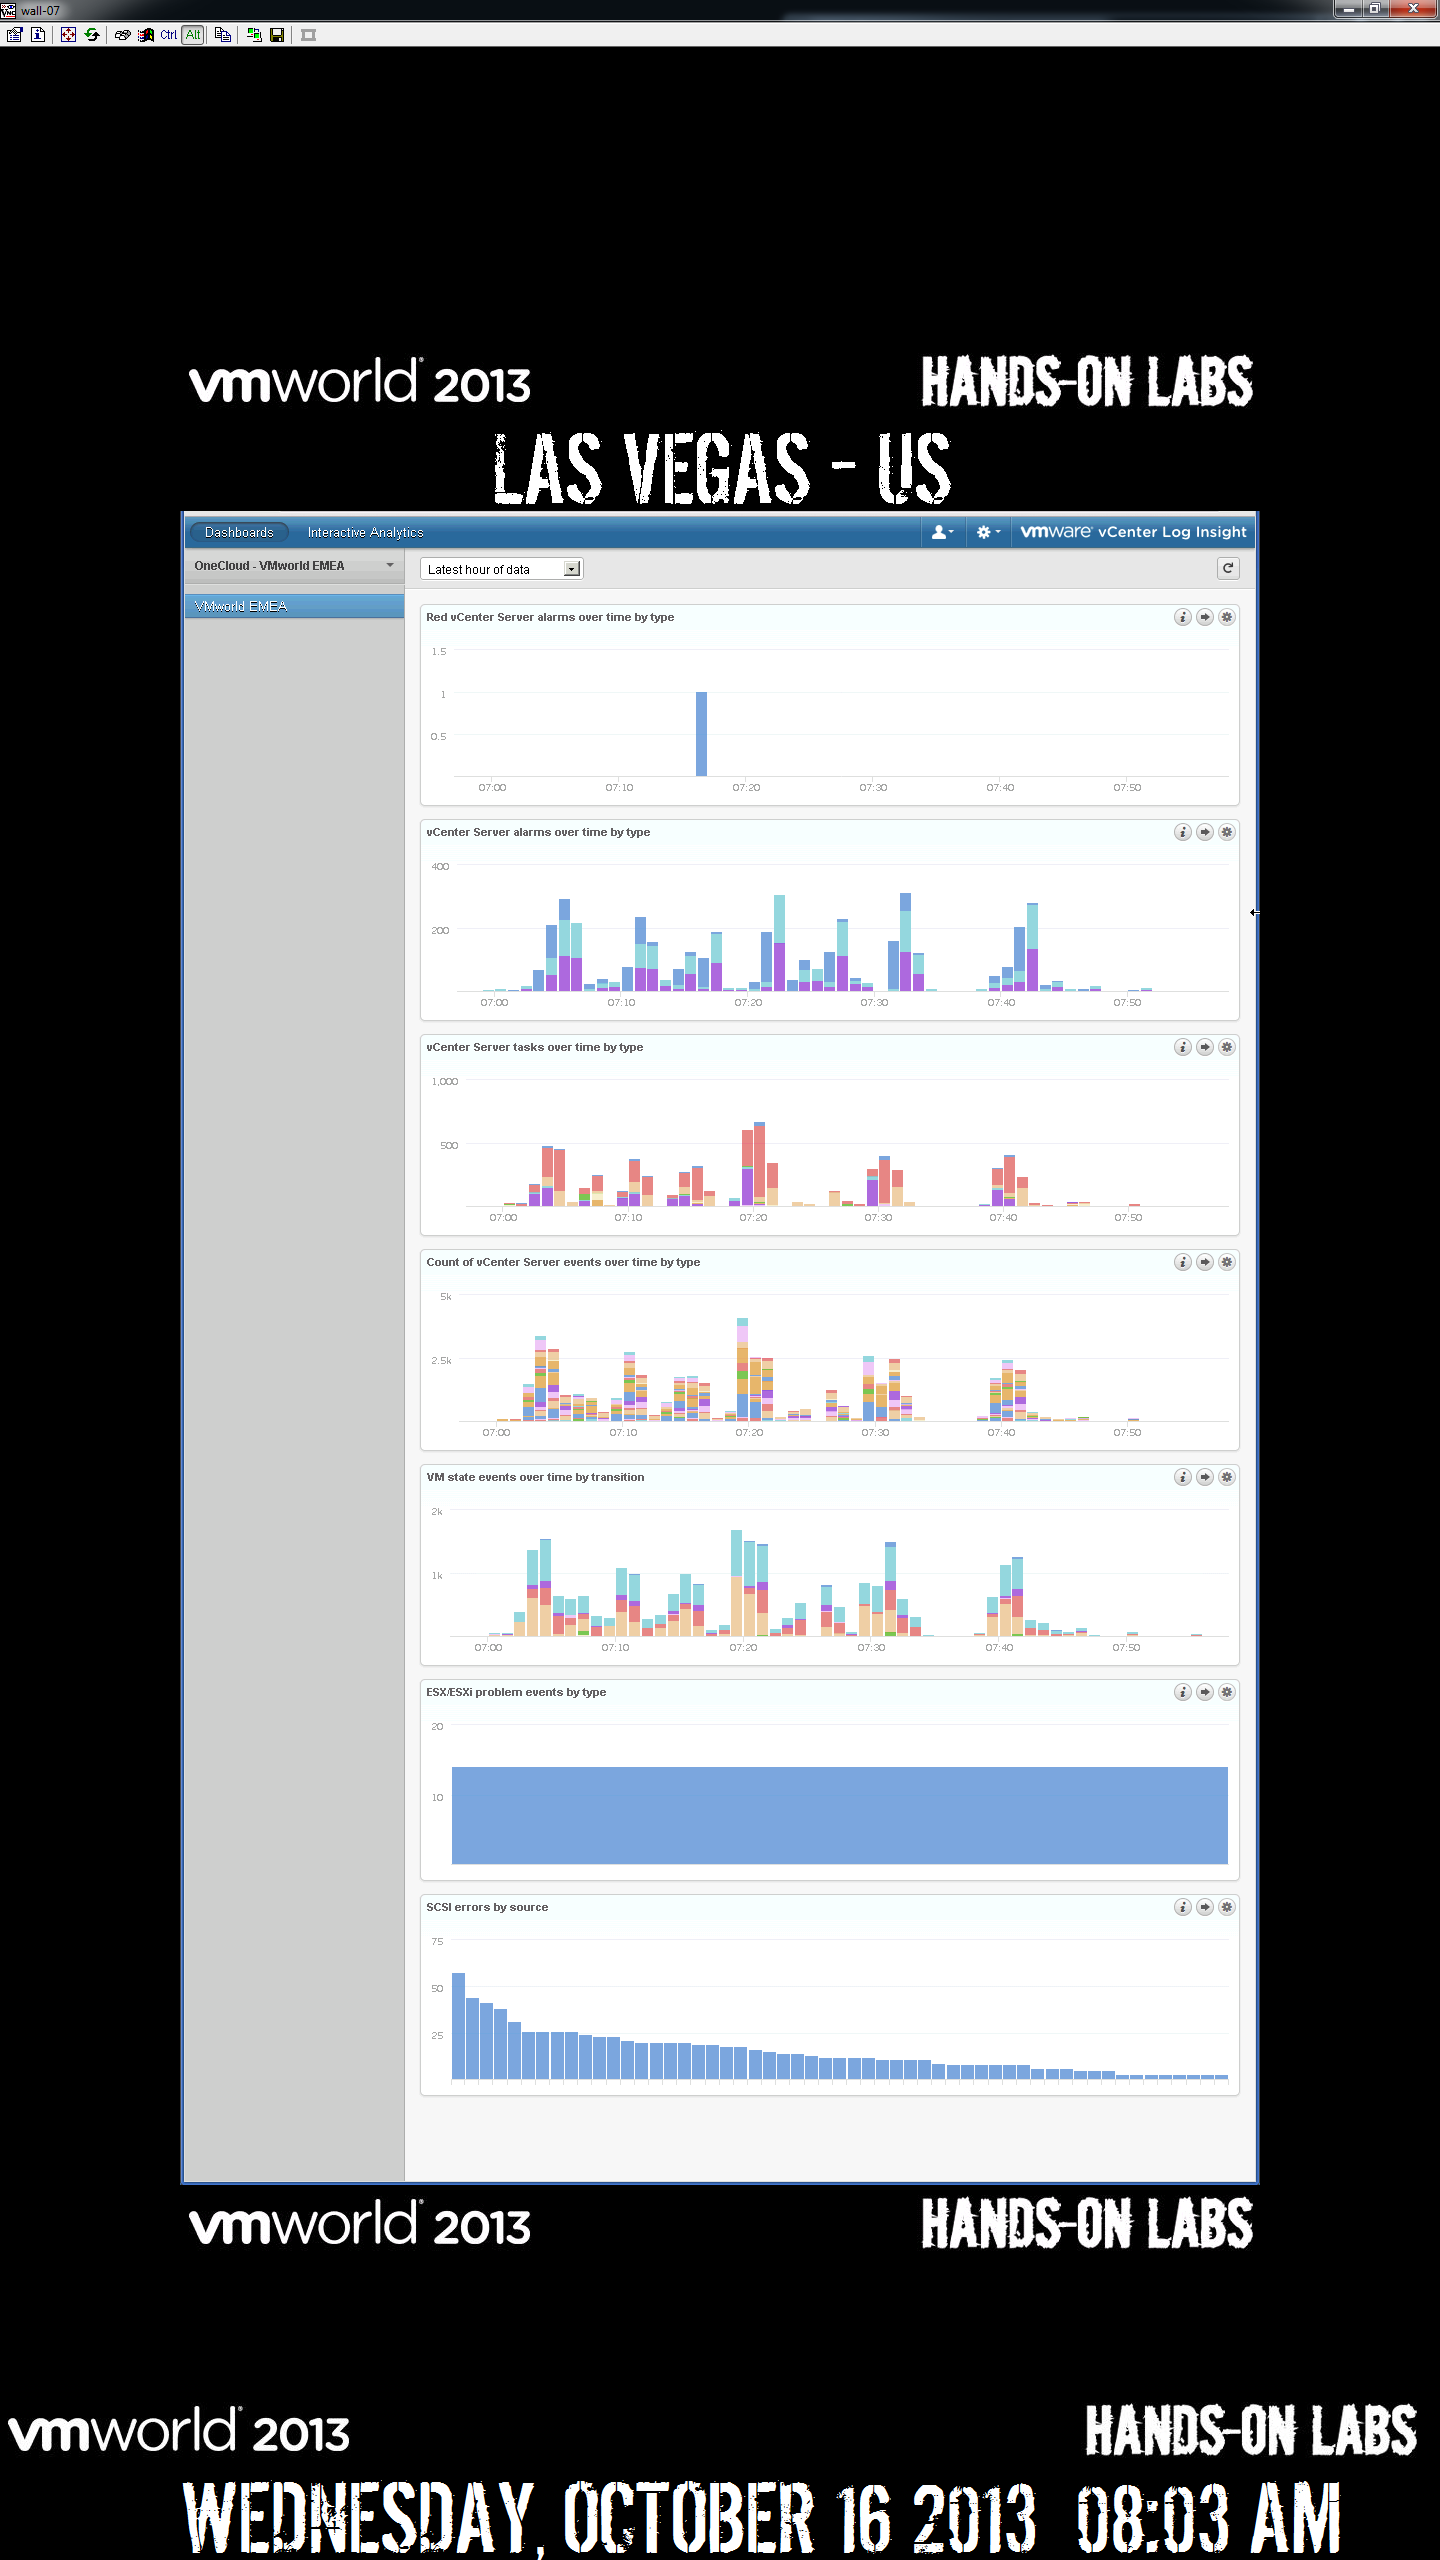
We also leveraged VMware vCenter Log Insight to consolidate our log views. This was very helpful for troubleshooting to be able to trace something throughout the stack. We also leveraged the alerting functionality to email us when known errors strings occurred in the logs so that we could be on top of any issue before users noticed.
Same as Screen #1 above, just for Las Vegas, again you notice more boxes, that is because it is twice the size. The London facility only ran the show, the Las Vegas DC below ran both the show and the public 24/7 Hands on Labs.
Same as #2 Above.
Same as #3 above, except that we show you the custom dashboard we created with VMware vCenter Log Insight, so that we could see trends of errors, this was very helpful to see when errors happen that we might otherwise not be looking for.
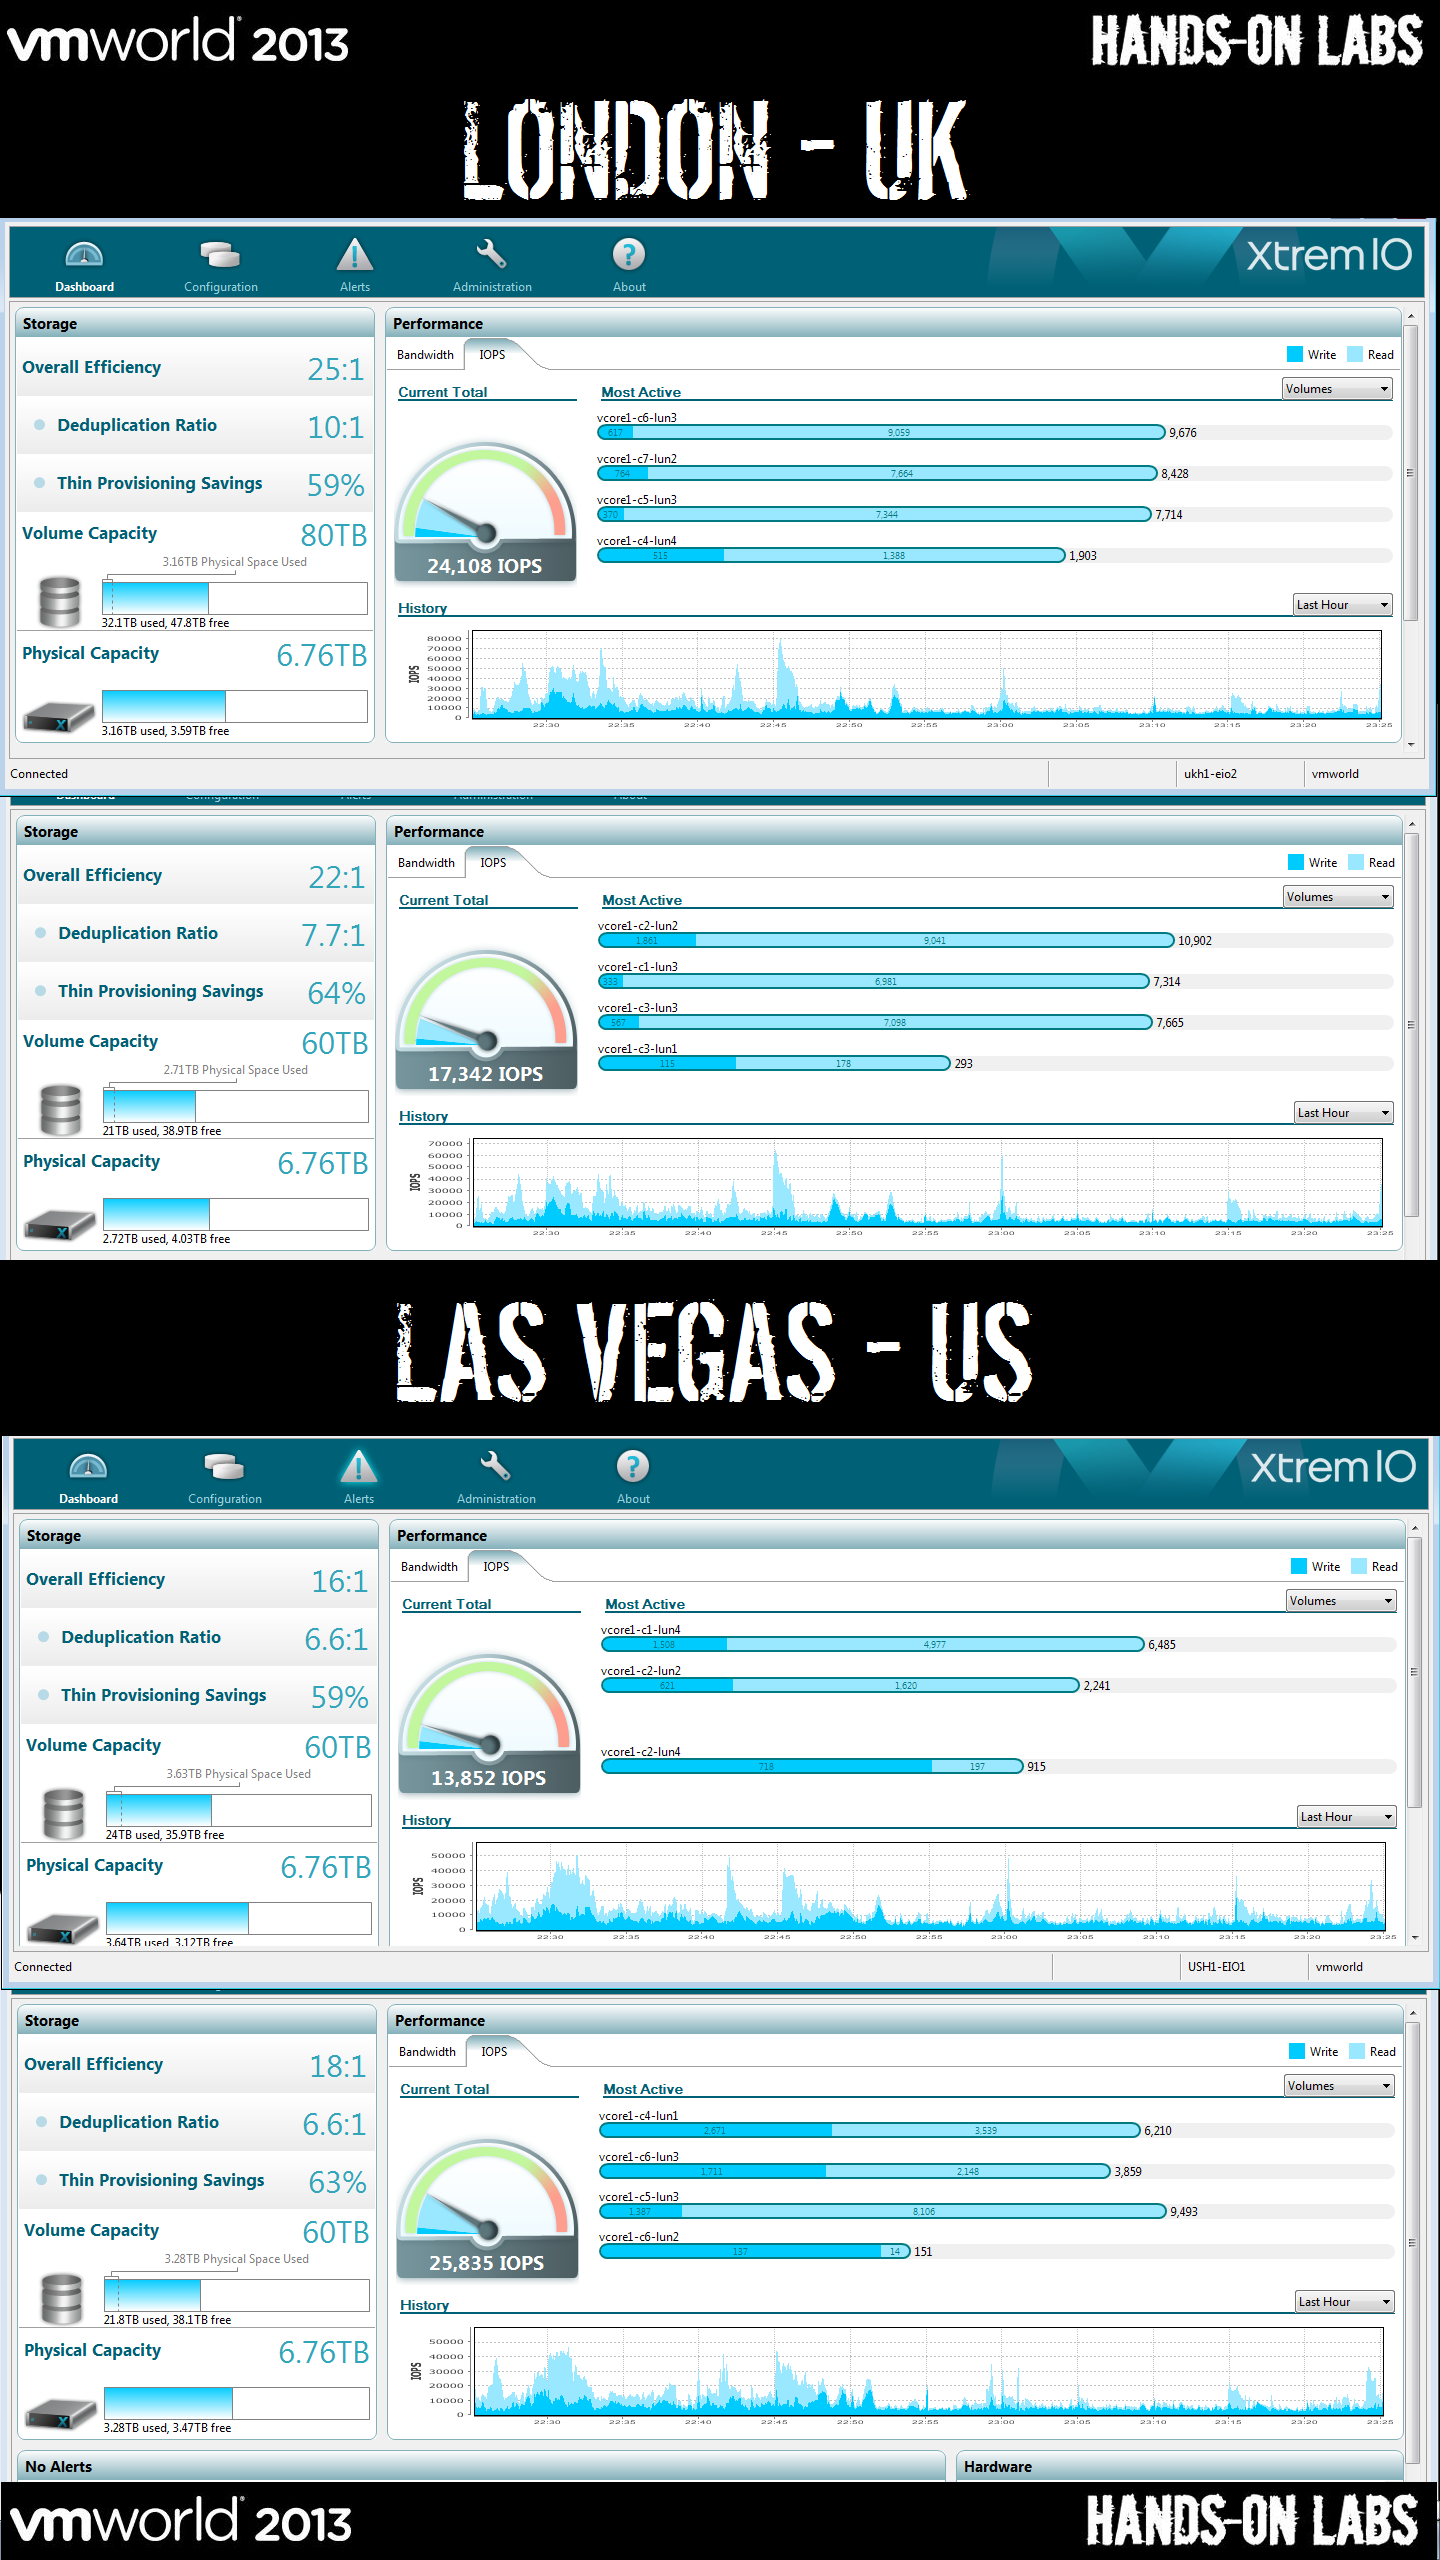
The final dashboard below is to watch the EMC XtremIO performance. These bricks had amazing performance and were able to handle any load we threw at it. With the inline deduplication we were able to use only a few TB of real flash storage to provide 100’s of TB of allocated storage. Matt Cowger from EMC did a great blog post about our usage
Final Numbers:
HOL US served 9,597 Labs with 85,873 VM’s
HOL EMEA served 3,217 Labs with 36,305 VM’s.
We achieved a nearly perfect uptime. We did have a physical blade failure, but HA kicked in and did it’s job, we also had a couple hard drive failures, once again a hot spare took over and automatically resolved the issue. During both occurrences, we saw a red spike from the vC Ops dashboards, we observed the issue, but did not need to make any changes, we just watched the technology magically self-heal as it’s supposed to.
Wednesday, August 28, 2013
VMworld HOL using VCVA (vCenter Virtual Appliance)
This is the first of a series of HOL posts about "how we did it".
For the primary workload, we used the vCenter Virtual Appliance using the local Postgres database.
Due to the unusually high churn rate of HOL, we need to have a high ratio of vCenters. These vCenters needed to have a lot of horsepower behind them to survive this churn.
1) Paravirtualized SCSI adaptors for disk controllers for the VCVA vm.
2) Created 2 additional dedicated datastores (Luns) for each of the DB & Logs on the VCVA vm.
3) 4 CPU's x 32GB memory (we might have gone a bit high on memory)
4) Removed all long term logging and rollups, we are doing all stats in vC Ops.
5) Increased heap sizes to large for the SPS, tomcat inventory & vCenter process.
The only downside to the VCVA is the fact that it doesn't support linked mode, but you can get around that with the NGC & SSO. http://www.virtuallyghetto.com/2012/09/automatically-join-multiple-vcsa-51.html
For the primary workload, we used the vCenter Virtual Appliance using the local Postgres database.
Due to the unusually high churn rate of HOL, we need to have a high ratio of vCenters. These vCenters needed to have a lot of horsepower behind them to survive this churn.
1) Paravirtualized SCSI adaptors for disk controllers for the VCVA vm.
2) Created 2 additional dedicated datastores (Luns) for each of the DB & Logs on the VCVA vm.
3) 4 CPU's x 32GB memory (we might have gone a bit high on memory)
4) Removed all long term logging and rollups, we are doing all stats in vC Ops.
5) Increased heap sizes to large for the SPS, tomcat inventory & vCenter process.
The only downside to the VCVA is the fact that it doesn't support linked mode, but you can get around that with the NGC & SSO. http://www.virtuallyghetto.com/2012/09/automatically-join-multiple-vcsa-51.html
Subscribe to:
Posts (Atom)