Monday, December 9, 2013

VMware vSAN IOPS testing

Take this with a grain of sand, these are only initial figures.  I am using a combination of IOMeter for Windows and fio for Linux.

Baseline redundancy and caching, no storage profiles used, only using vSAN as a datastore (I’ll do the other options later)

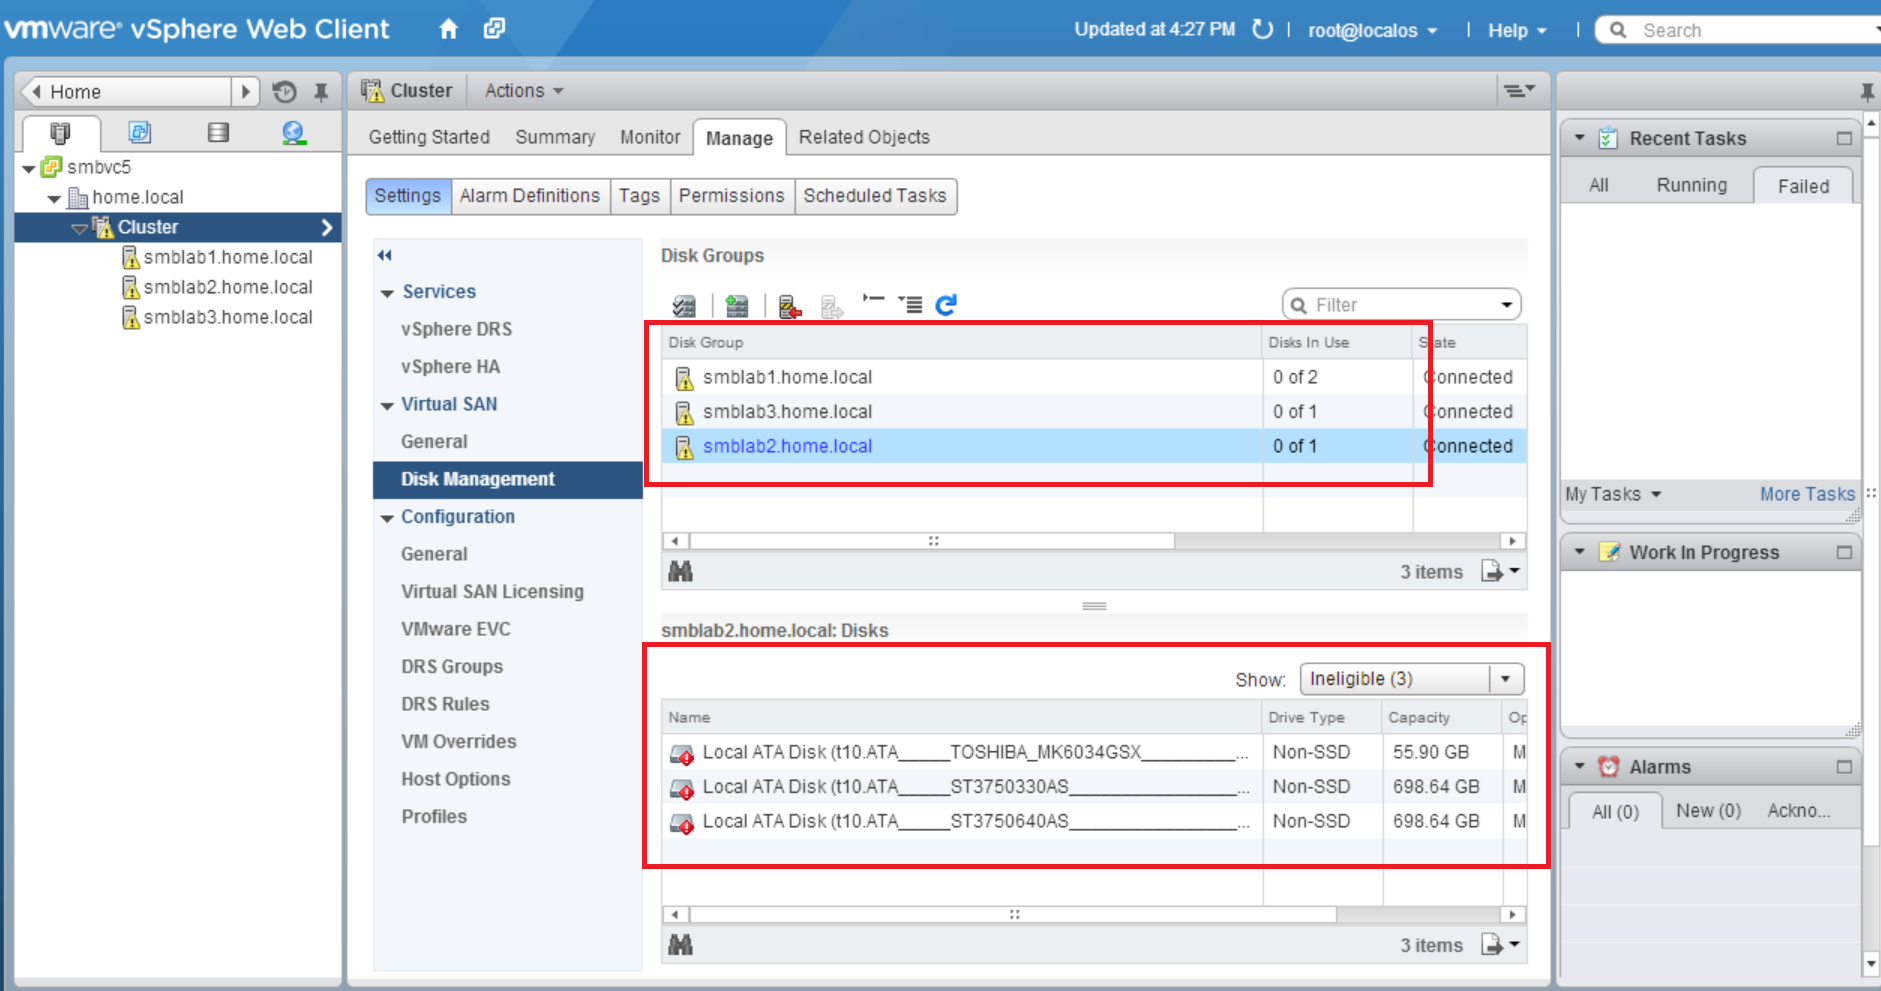
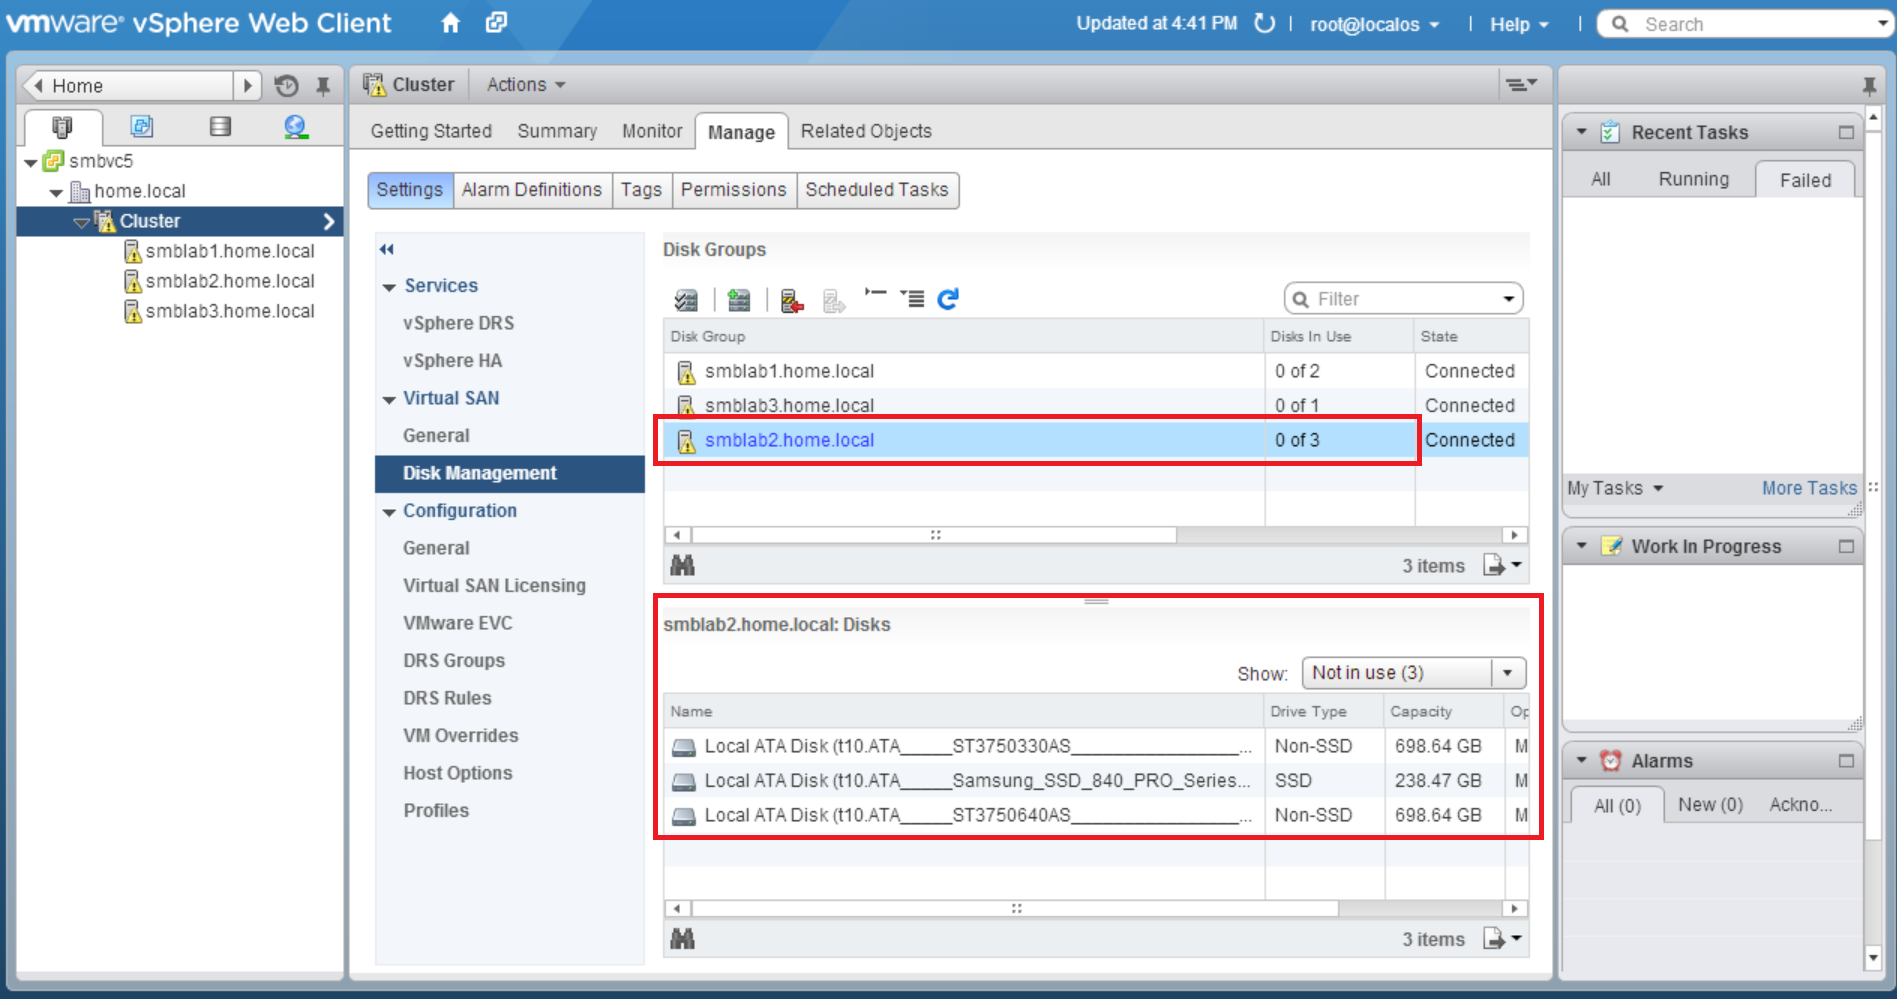
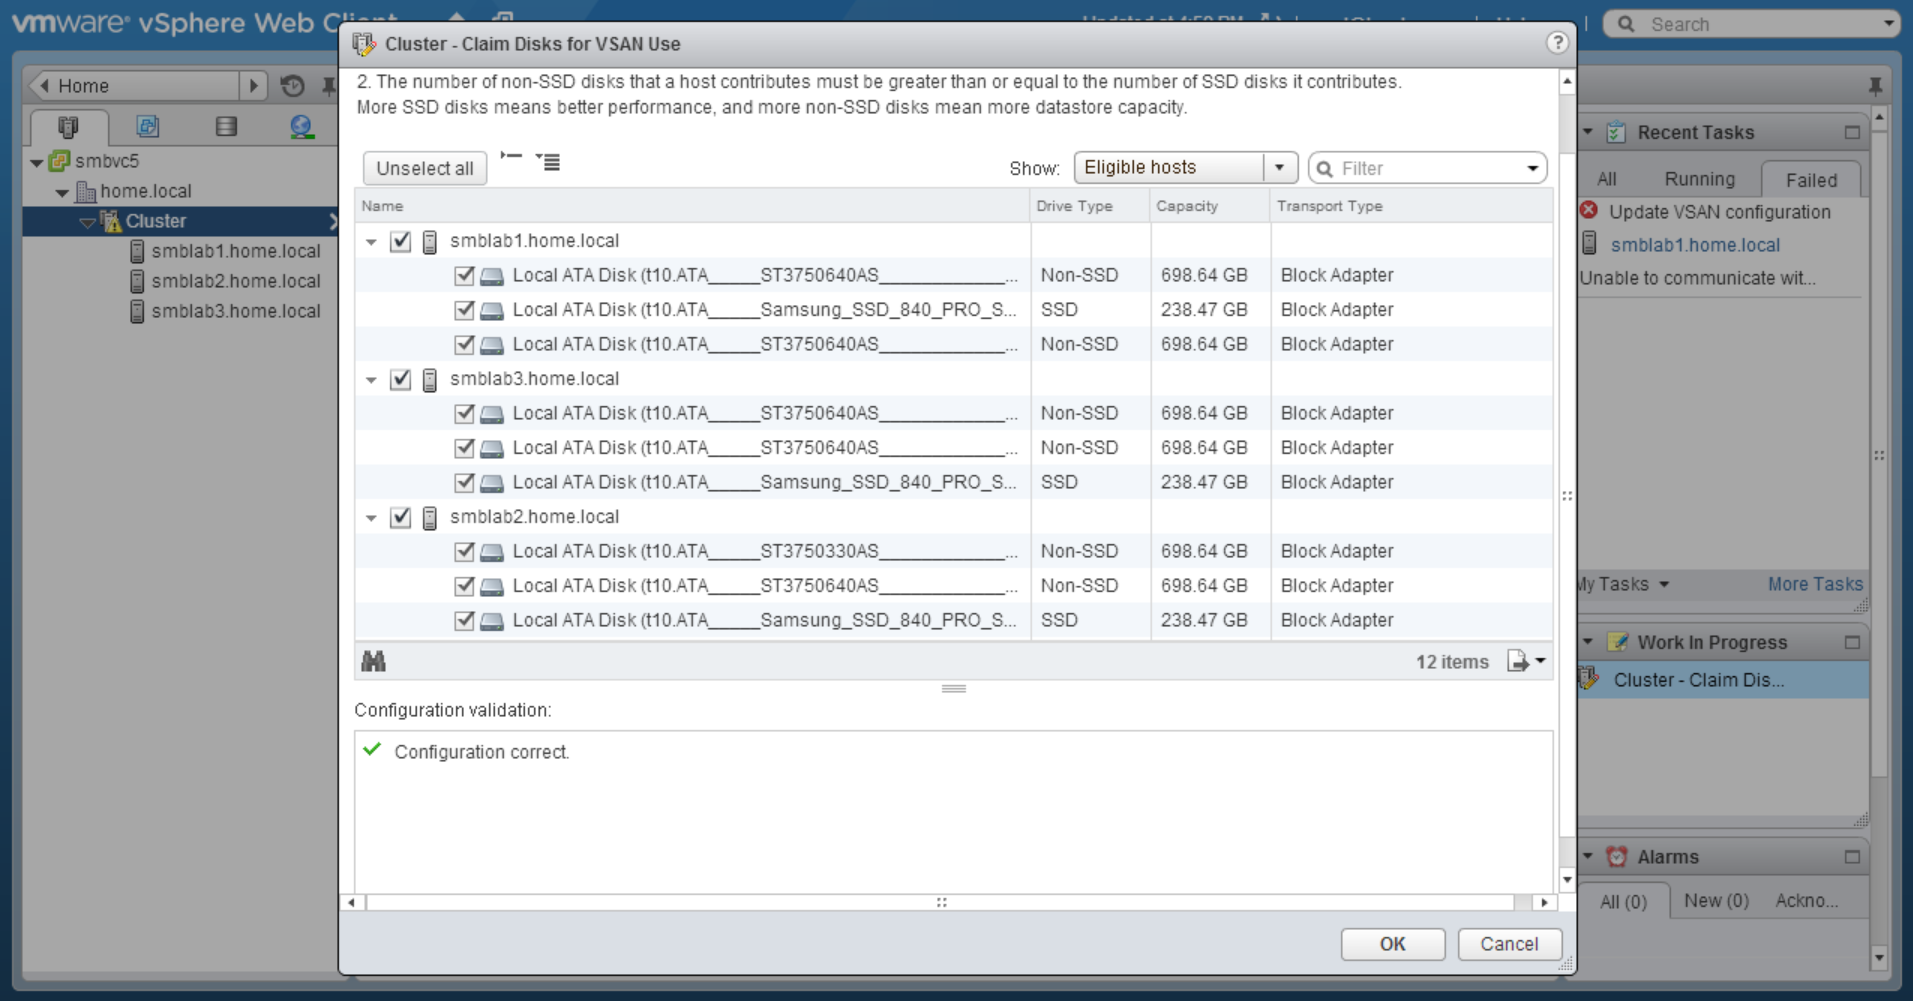
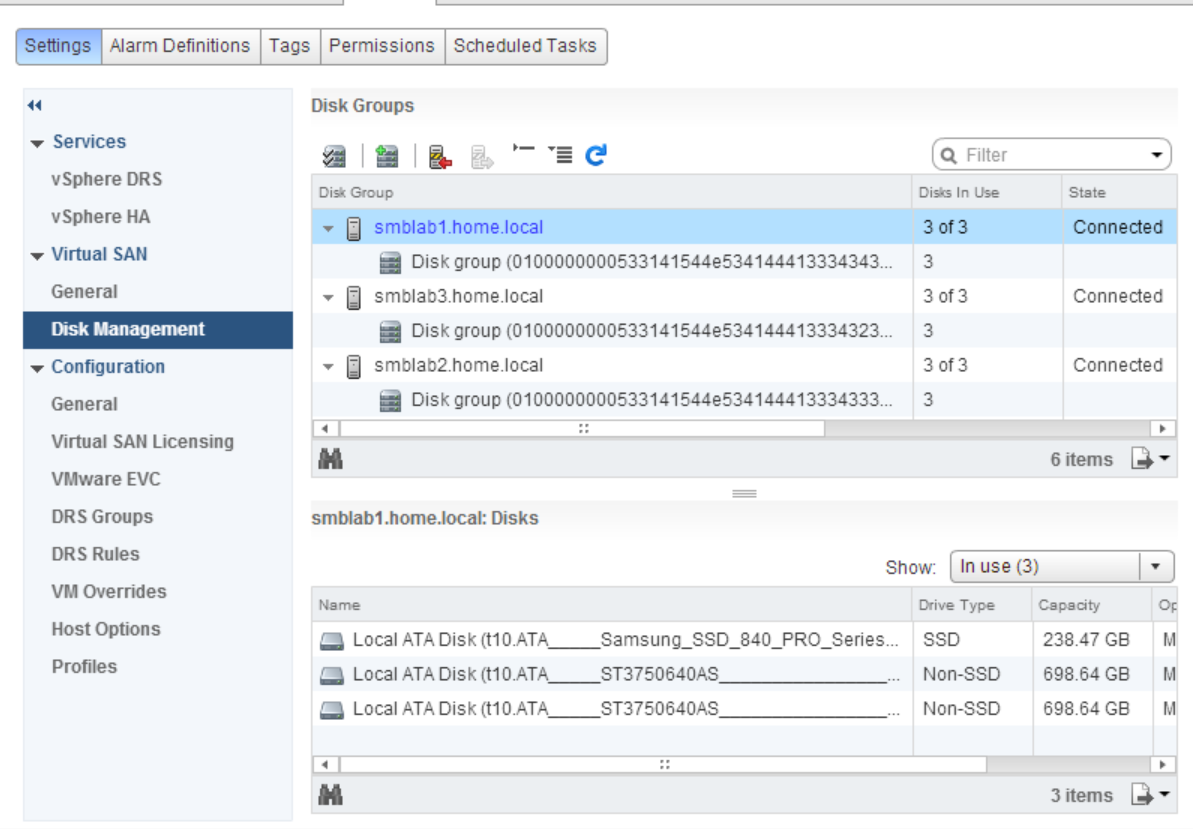
My vSAN is made of 3 identical ESXi hosts, with a single SSD Samsung 840 250GB, and two Seagate 750GB SATA drives. vSAN has a dedicated single 1GB connection, no jumbo frames used. (yes there could be bottlenecks at several spots, I haven’t dug that deeply, this is just a ‘first pass’ test)

The end result of this VERY BASIC test is this:

vSAN random reads were an average of 31 times faster than a single SATA disk

vSAN random writes were an average 9.1 times faster than a single SATA disk


More Details Below:

Regular single disk performance (just for a baseline before I begin vSAN testing)

Random Read (16k block size)

first test = 79 IOPS

second test = 79 IOPS

Random Write (16k block size)

first test = 127 IOPS

second test = 123 IOPS

vSAN disk performance with same VM vMotion to the vSAN

Random Read (16k block size)

first test = 2440 IOPS

second test = 2472 IOPS

Random Write (16k block size)

first test 1126 IOPS

second test 1158 IOPS

Commands used in fio:

sudo fio --directory=/mnt/volume --name fio_test --direct=1 --rw=randread --bs=16k --size=1G --numjobs=3 --time_based --runtime=120 —-group_reporting

sudo fio --directory=/mnt/volume --name fio_test --direct=1 --rw=randwrite --bs=16k --size=1G --numjobs=3 --time_based --runtime=120 —-group_reporting

I mentioned I did use IOMeter in windows, the initial results were very similar to the fio results above.  I will post those once I have the time try each solution and go deeper into identifying bottlenecks and getting more detailed, adding more hosts, etc…

Sunday, December 8, 2013

VMware vSphere 5.5 vSAN beta ineligable disks

While building my home lab to use vSAN and NSX following Cormac Hogans's great instructions, I've encountered an issue that the disk I am trying to use for vSAN are not showing as available. In the "Cluster/Manage/Virtual SAN/Disk Management" under Disk Groups, I see only one of my 3 hosts has 0/2 disks in use, the others show 0/1. My setup is this, I purchased 3 new 250GB Samsung SSD drives (one for each host), and am trying to re-use 6 older Seagate 750GB SATA drives. My first thought, is why does it only say 0/1 in use on two of the servers?  I have 4 drives in that server, a 60GB boot drive, 1 SSD, & 2 SATA drives, so why doesn't it say 0/3 or 0/4? I noticed in the bottom pane, I can choose to show ineligable drives, there I see the 3 drives I can't use. I understand why I can't use my Toshiba boot drive, but why do my 750GB Seagate drives also show Ineligable?


I played with enabling AHCI, but knowing there is a bug in the beta I wanted to avoid it. See here: http://blogs.vmware.com/vsphere/2013/09/vsan-and-storage-controllers.html. This unfortunately did not change the situation. I finally realized that possibly those drives still had a legacy partition on them. After nuking the partitions on those drives, the disk now show up as eligable drives. I tried this first on my server smblab2, and you see that 0/3 are not in use, which is what I would have expected originally.  Not in use in this context basically means "eligable".


I was then able to Claim the disks for VSAN Use:


Then finally create the disk groups.


Many others suggest running vSAN in a Virtual environment, which is great for learning, you can even get the experience doing the Hands on Labs (Free 24/7 Now!), but I wanted to do some performance testing, and for that I needed a physical environment. Now that I've gotten past my little problem, it's working great!

Monday, November 25, 2013

VMworld 2013 Hands On Labs Dashboards

I’ve been asked several times to publish these as not everyone got to take pictures, or they were not clear enough. 

We chose to build custom VMware® vCenter™ Operations Management Suite™ (vC Ops) dashboards.  The Built-in vC Ops dashboards are build around a normal datacenter where workloads live indefinitely, and trending is key, for our environment, workloads are created and destroyed so frequently, that this data isn’t key.  Also in a normal environment, the VM’s are crucial, but in ours, the infrastructure is.

HOL was built with two major sites for each show.  For the EMEA VMworld, we used London & Las Vegas.  The dashboards below were taken right before the show opened in the morning, so there isn’t much if any load in London, there is some load in Las Vegas because that is where we were running the 24/7 public Hands on Labs.  The first dashboard for each site contains metrics around traditional constraints, such as CPU, Memory, Storage IOPS, Storage Usage, & Network Bandwidth.  These are all done at the vCenter level as the lab VM’s only live 90 minutes we really don’t care much about their individual performance as we can’t tune them before they are recycled.  We do care about the underlying infrastructure and we are watching to make sure they have plenty of every resource so that they can run optimally.   Much of the data that we fed into vC Ops comes from vCenter Hyperic

London1

The second dashboard below is looking at vCloud Director Application performance.  We looked directly into inspecting each Cell Server for # of proxy connections, cpu, & memory.  We also looked  into the vSM to verify the health of the vShield Manager VM’s.  Lastly we were concerned with the SQL DB performance, so we were watching the transactional performance, making sure there wasn’t too many waiting tasks, or DB wait times.

London2

We also leveraged VMware vCenter Log Insight to consolidate our log views.  This was very helpful for troubleshooting to be able to trace something throughout the stack.  We also leveraged the alerting functionality to email us when known errors strings occurred in the logs so that we could be on top of any issue before users noticed.

london3

Same as Screen #1 above, just for Las Vegas, again you notice more boxes, that is because it is twice the size.  The London facility only ran the show, the Las Vegas DC below ran both the show and the public 24/7 Hands on Labs.

vegas1

Same as #2 Above.

vegas2

Same as #3 above, except that we show you the custom dashboard we created with VMware vCenter Log Insight, so that we could see trends of errors, this was very helpful to see when errors happen that we might otherwise not be looking for.

vegas3

The final dashboard below is to watch the EMC XtremIO performance.  These bricks had amazing performance and were able to handle any load we threw at it.  With the inline deduplication we were able to use only a few TB of real flash storage to provide 100’s of TB of allocated storage.  Matt Cowger from EMC did a great blog post about our usage

xio

Final Numbers:

HOL US served 9,597 Labs with 85,873 VM’s

HOL EMEA served 3,217 Labs with 36,305 VM’s.

We achieved a nearly perfect uptime.  We did have a physical blade failure, but HA kicked in and did it’s job, we also had a couple hard drive failures, once again a hot spare took over and automatically resolved the issue.  During both occurrences, we saw a red spike from the vC Ops dashboards, we observed the issue, but did not need to make any changes, we just watched the technology magically self-heal as it’s supposed to.

Wednesday, August 28, 2013

VMworld HOL using VCVA (vCenter Virtual Appliance)

This is the first of a series of HOL posts about "how we did it".

For the primary workload, we used the vCenter Virtual Appliance using the local Postgres database.

Due to the unusually high churn rate of HOL, we need to have a high ratio of vCenters.  These vCenters needed to have a lot of horsepower behind them to survive this churn.

1) Paravirtualized SCSI adaptors for disk controllers for the VCVA vm.
2) Created 2 additional dedicated datastores (Luns) for each of the DB & Logs on the VCVA vm.
3) 4 CPU's x 32GB memory (we might have gone a bit high on memory)
4) Removed all long term logging and rollups, we are doing all stats in vC Ops.
5) Increased heap sizes to large for the SPS, tomcat inventory & vCenter process.

The only downside to the VCVA is the fact that it doesn't support linked mode, but you can get around that with the NGC & SSO.   http://www.virtuallyghetto.com/2012/09/automatically-join-multiple-vcsa-51.html

ESXi 5.1vHost vDS ports on an stateless reverts to 512 after reboot

By default when you set the ports on hosts max to 1024, after reboot, it goes back to 512 on a stateless host. This is a known issue in the 5.1 release notes.
  • maxProxySwitchPorts setting not persistent after stateless host reboot 
  • The maximum number of ports on a host is reset to 512 after the host is rebooted and a host profile applied. When you set maxProxySwitchPorts on a specific stateless host on a distributed switch, the setting might not persist when the host is rebooted. This applies only to stateless hosts that are part of a distributed switch and have had themaxProxySwitchPorts setting changed.
  • Workaround: Manually change the maxProxySwitchPorts settings for the hosts after reboot.

There are 3 ways to make this change, i'll discuss them here.

1) vSphere Windows Client, this way seems to work, but does not.  The UI states that the host must be rebooted after the setting is changed. Some experimenting looked like the change did take effect immediately without a reboot and I've confirm in the API guide that a reboot is no longer needed for ESXi 5.1 hosts (http://pubs.vmware.com/vsphere-51/index.jsp?topic=%2Fcom.vmware.wssdk.apiref.doc%2Fvim.dvs.HostMember.ConfigSpec.html), so the "must reboot" label just a UI artifact.

2) Workaround stated above in the release notes using PowerCLI, While changing the maxProxySwitchPorts with PowerCLI does work, it's a pain. 

3) Using the NGC (next gen web client).  We found the workaround to be setting the "Default max number of ports per host" via the NGC and this does persist between reboots. We tested this on a host that we rebooted and it did come up with 1024 ports. 


The credit for this goes to my members, Jacob RossJoe Keegan.


Wednesday, July 3, 2013

vSphere 5.1 Update1 PSOD Fix Build

VMware released 5.1U1 on April 25th with Build 1065491.  There were some critical bugs identified and fixed, so if you are using 5.1U1 with Intel Processors, you may want to use build 1117900, which came out May 22nd.  This build fixes some bugs about occasional PSOD (purple screen of death) related Flex Priority in Intel processors (part of the VT featureset).  

Here is the Build KB http://kb.vmware.com/selfservice/microsites/search.do?language=en_US&cmd=displayKC&externalId=2051207

Download the Build http://www.vmware.com/patchmgr/findPatch.portal?product=ESXi+(Embedded+and+Installable)&version=121

Tuesday, July 2, 2013

Storage IOPS Planning


The limit on the VNX is the Storage Processors.  Utilizing the aggressive numbers is likely to see significant impact to the workloads.

Array Conservative Typical Aggressive
VNX7500 60,000 80,0000 100,000
S200 Isilon 8,000 (per node) 10,000 12,000

Thursday, May 9, 2013

New performance and optimizations guides for Cloud and vSphere

vCloud
http://www.vmware.com/files/pdf/techpaper/VMware-vCloud-Director51-Perf.pdf
vSphere
http://www.vmware.com/pdf/Perf_Best_Practices_vSphere5.1.pdf

Getting your memory savings back on with ESXi and small memory pages

Many other VCDX's have posted all the technical details about this before, so this isn't revolutionary, but back in the day's of 32 bit OS's their memory was stored in small 4k pages on the ESXi host.  TPS was great at comparing and colapsing these and generating huge memory savings, typically about 30%.  Now with modern 64 bit OS's, this memory is stored in large 2MB pages by default.  The reason for the large pages is some performance enhancement, and i'm sure in a highly CPU/Memory latency sensitive environment there is some benefit.  However, in every environmnet I've ever worked in, the bottleneck is qty of memory and disk I/O.  TPS does begin to break down the large pages into smaller pages when the system is in the last 6% of memory available, before it starts to swap, this is great, but usually, it's too late to really matter.  I recommend disabling the large pages, and therefore having ESXi store it in the smaller blocks.  You can force this to happen by changing a property on ESXi on the host under advanced "mem" called Mem.AllocGuestLargePage and change it from 1 = large pages enabled to 0 = large pages disabled.  After you reboot the host, your VM's should begin to use the smaller pages and almost immediately begin saving your memory with TPS.

Friday, April 26, 2013

vDS port limits

Mnaging the maximum number of ports you can have on a distributed switch has always been difficult for those of us running large clouds.  It appears that with vSphere 5.1 that limit has mostly been removed.  In vSphere 4.0 the limit was 4,096, in 4.1, it was 8,192 but could be modified with PowerCLI to 20,000.  As of vSphere 5.0 the limit was 30k, now in 5.1 that limit is 60k.  However today we discovered the limit in the database is actually 2,147,483,647 (2.1Billion).  I guess I won't have to worry about those errors anymore...

Monday, March 11, 2013

Datastore connectivity issues

We have a shared datastore to provide global catalogs to our various ORG's in the vCloud.  For whatever reason several ESX hosts across mulitple clusters were reporting APD (all path's down) when trying to connect to this VNX NFS Export.  After putting those hosts into maintenance mode, everything seemed happy again.   We did quite a bit of digging, it turned out all servers had the same patch level, the NFS export seemed properly configured, we were stumped.  Looking on the Nexus 7k, we saw that one of the ports in the VNX portchannel had a low Rx Power -11.30 dBm, and 75414 CRC errors on RX.  Once we replaced the SFP & Fiber Optic Cable, everything is happy again.