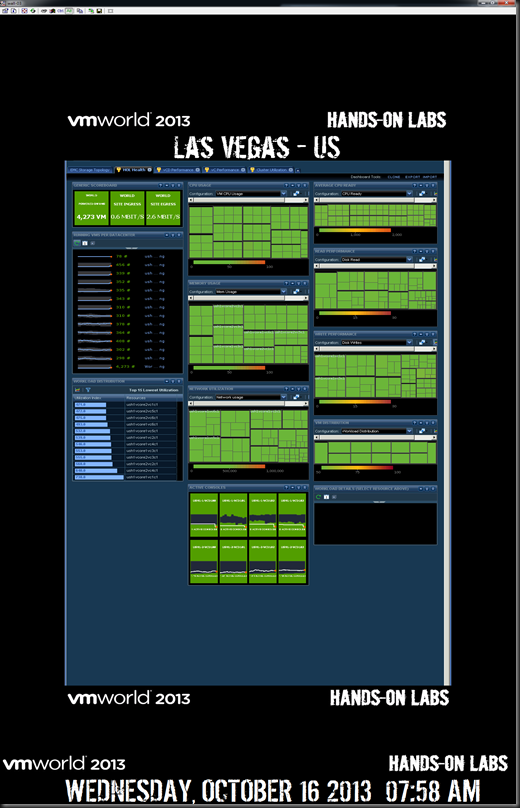
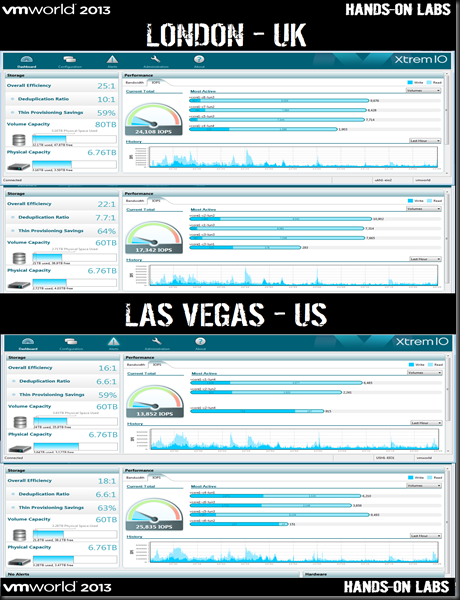
I’ve been asked several times to publish these as not everyone got to take pictures, or they were not clear enough.
We chose to build custom VMware® vCenter™ Operations Management Suite™ (vC Ops) dashboards. The Built-in vC Ops dashboards are build around a normal datacenter where workloads live indefinitely, and trending is key, for our environment, workloads are created and destroyed so frequently, that this data isn’t key. Also in a normal environment, the VM’s are crucial, but in ours, the infrastructure is.
HOL was built with two major sites for each show. For the EMEA VMworld, we used London & Las Vegas. The dashboards below were taken right before the show opened in the morning, so there isn’t much if any load in London, there is some load in Las Vegas because that is where we were running the 24/7 public Hands on Labs. The first dashboard for each site contains metrics around traditional constraints, such as CPU, Memory, Storage IOPS, Storage Usage, & Network Bandwidth. These are all done at the vCenter level as the lab VM’s only live 90 minutes we really don’t care much about their individual performance as we can’t tune them before they are recycled. We do care about the underlying infrastructure and we are watching to make sure they have plenty of every resource so that they can run optimally. Much of the data that we fed into vC Ops comes from vCenter Hyperic
The second dashboard below is looking at vCloud Director Application performance. We looked directly into inspecting each Cell Server for # of proxy connections, cpu, & memory. We also looked into the vSM to verify the health of the vShield Manager VM’s. Lastly we were concerned with the SQL DB performance, so we were watching the transactional performance, making sure there wasn’t too many waiting tasks, or DB wait times.
We also leveraged VMware vCenter Log Insight to consolidate our log views. This was very helpful for troubleshooting to be able to trace something throughout the stack. We also leveraged the alerting functionality to email us when known errors strings occurred in the logs so that we could be on top of any issue before users noticed.
Same as Screen #1 above, just for Las Vegas, again you notice more boxes, that is because it is twice the size. The London facility only ran the show, the Las Vegas DC below ran both the show and the public 24/7 Hands on Labs.
Same as #2 Above.
Same as #3 above, except that we show you the custom dashboard we created with VMware vCenter Log Insight, so that we could see trends of errors, this was very helpful to see when errors happen that we might otherwise not be looking for.
The final dashboard below is to watch the EMC XtremIO performance. These bricks had amazing performance and were able to handle any load we threw at it. With the inline deduplication we were able to use only a few TB of real flash storage to provide 100’s of TB of allocated storage. Matt Cowger from EMC did a great blog post about our usage
Final Numbers:
HOL US served 9,597 Labs with 85,873 VM’s
HOL EMEA served 3,217 Labs with 36,305 VM’s.
We achieved a nearly perfect uptime. We did have a physical blade failure, but HA kicked in and did it’s job, we also had a couple hard drive failures, once again a hot spare took over and automatically resolved the issue. During both occurrences, we saw a red spike from the vC Ops dashboards, we observed the issue, but did not need to make any changes, we just watched the technology magically self-heal as it’s supposed to.


